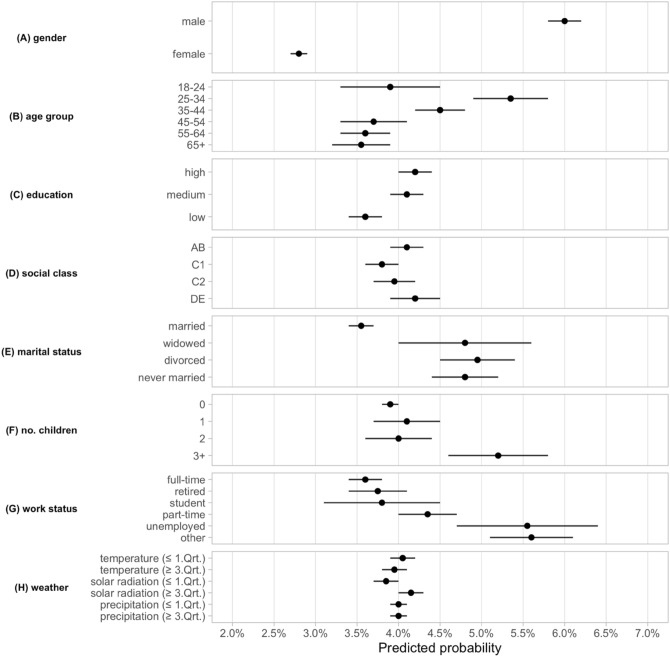
Figure 2.
The predicted probabilities (in %) for non-compliance with lockdown policies were largest for male, young, unemployed, non-married ones or parents with more than two children. The plot shows the predicted probability of non-compliance when each individual level characteristic is equal to 1, while all other covariates are held constant at their mean values. The estimates are based on a logistic regression with date and region fixed effects included and robust standard errors clustered at the region level. The horizontal lines show the 95% confidence intervals. N = 105,512.

