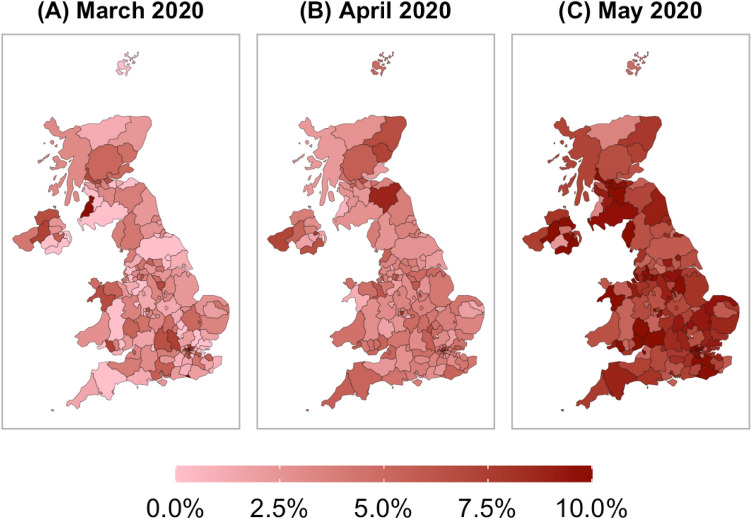
Figure 4.
The share of non-compliance varied across regions and over. The panels show the share of non-compliers for each NUTS3 region for different months. In general, non-compliance was the highest in May (C) and the lowest in March (A), although regional variation exists in all months. Due to these large variations of non-compliance and weather indicators across regions, the inclusion of geographical fixed effects was important to condition on region-specific unobservables. Sample weights are applied. N = 105,512. The maps were created with the programming language R26.

