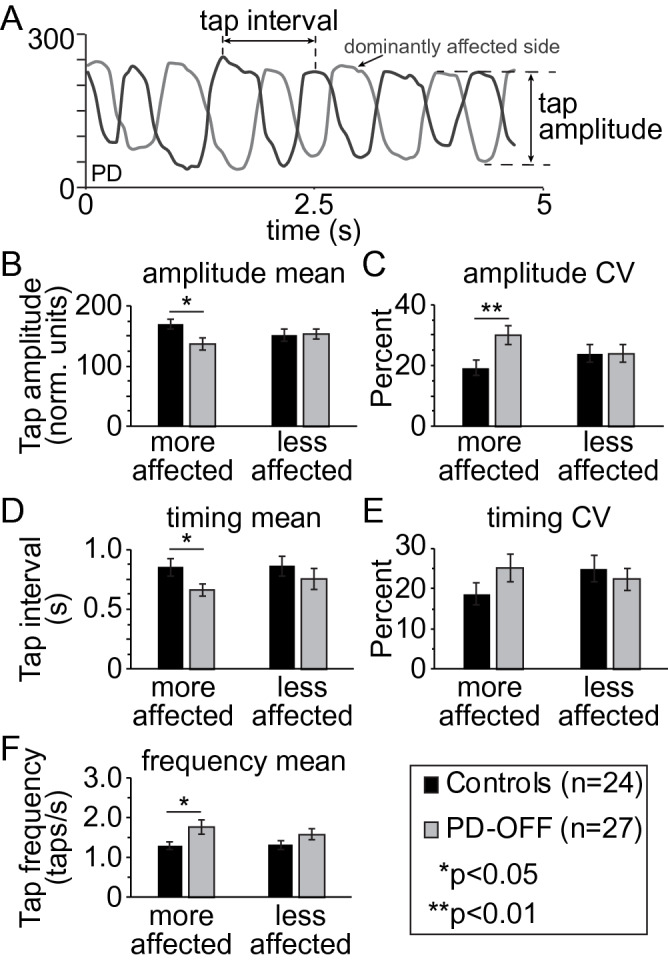
Figure 1.

Spatiotemporal parameters of upper limb finger tapping. (A) Sample trace showing bimanual finger tapping output using the data glove in a participant with PD in the levodopa OFF state. Definitions of tap interval and tap amplitude are shown. Mean and variability (CV) in finger tap amplitude (B, C) finger tap interval (D, E), and tap frequency (F) for the more affected (MA) and less affected (LA) hands are shown for controls and PD participants OFF levodopa (PD-OFF). Bar graphs are plotted as the mean ± SEM.
