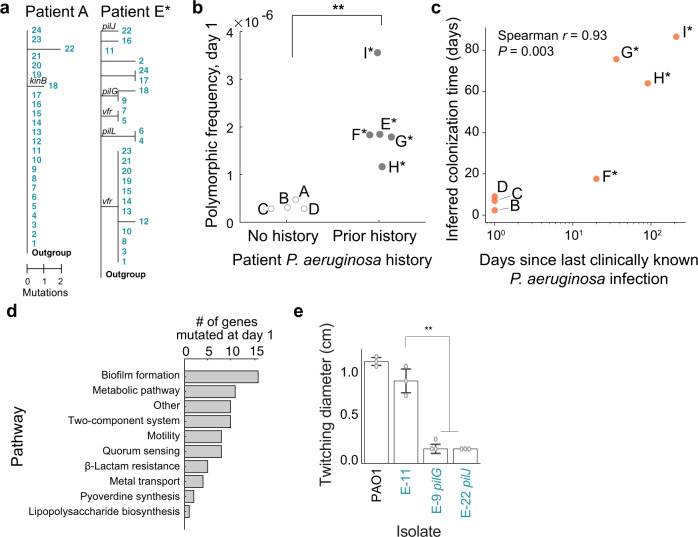
Fig. 2. Patient infection history impacts genomic diversity of P. aeruginosa at the onset of infection.
a Phylogenetic trees of P. aeruginosa populations in pilot patients A and E* rooted with an Outgroup (Methods). Numbers (rows) correspond to tree leaves (teal) representing an isolate. Scale: mutational events (single nucleotide polymorphisms (SNPs) and indels) from the most recent common ancestor (MRCA) in each patient. Select branches are labeled with mutated genes. b Comparing the initial pathogen diversity of patients (dots) based on prior history of P. aeruginosa infection. Frequency of polymorphic loci (y-axis; calculated as number of unique SNP or indel positions divided by genome size) in patients with no prior P. aeruginosa history vs. in patients with clinically documented infection history (x-axis). Significance: P = 0.007, two-sided t-test. c Relation between the estimated colonization time of the pathogen in each patient (days, y-axis; Methods) and time to the last clinically documented infection (days, x-axis). Spearman correlation (two-sided), r = 0.93, P = 0.003. d Pathways (y-axis) found in mutations of coding regions at day 1 (x-axis) across all patients. e Altered twitching phenotype in isolates with single point mutations in genes of the pil locus. Isolates (x-axis) assayed for twitching diameter (cm, y-axis; Methods), from left to right: PAO1 reference strain, E-11 isogenic control, E-9 singleton pilG mutant, E-22 pilJ singleton mutant. Each assay was conducted across 3 technical replicates (dots), representative of 3 biologically independent replicates. Bars show median; error bars, standard error (s.e.). Significance: Tukey’s multiple comparisons test (E-11 vs. E-9, P = 0.001; E-11 vs. E-22, P = 0.001; adjusted P-values).

