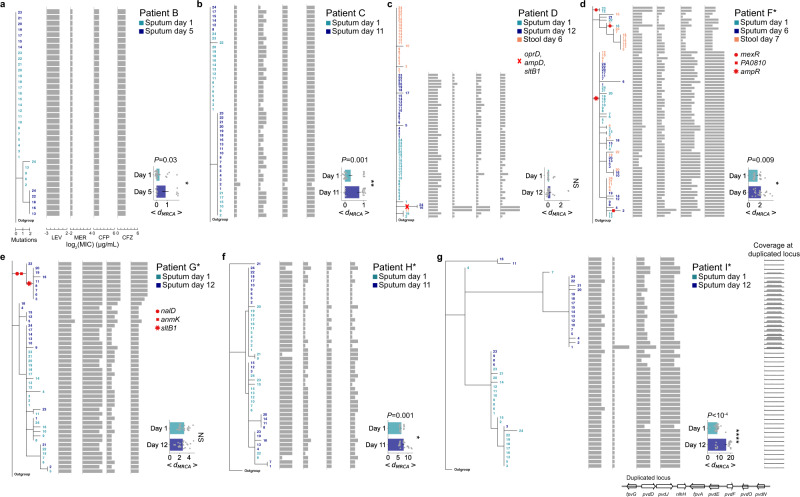
Fig. 3. Phylogenetic analyses of P. aeruginosa populations within each patient and their corresponding antibiotic resistance profiles.
a–g Left: Phylogenetic trees of P. aeruginosa populations in serially sampled patients: patient B (a), patient C (b), patient D (c), patient F* (d), patient G* (e), patient H* (f), patient I* (g). Numbers (rows) correspond to tree leaves that represent an isolate (day 1 sputum in teal, follow-up sputum in dark blue, stool in brown). Scale: mutational events (single nucleotide polymorphisms (SNPs) and indels) from the most recent common ancestor (MRCA) in each patient. A subset of branches associated with antibiotic resistance are marked with red symbols. Middle: Antibiotic resistance profiles (horizontal gray bars) in units of minimum inhibitory concentration (log2(MIC); µg/mL) of individual isolates (rows) aligned to the isolate’s position on the tree, shown for levofloxacin (LEV), meropenem (MER), cefepime (CFP), and ceftazidime (CFZ). Right: distance to the MRCA (<dMRCA>, x-axis) of isolates (gray dots) at each time point (y-axis, days of infection). Mean (horizontal bars) and standard error (error bars) calculated over n = 24 biologically independent isolates per sputum or stool sample (exception: n = 12 isolates in Day 5 sputum of patient B (a)). Significance, one-tailed permutation test: P = 0.03 (a), P = 0.001 (b), P = 0.009 (d), P = 0.001 (f), P < 10−4 (g). NS not significant. g Far right, bottom: schematic showing the relative copy number (y-axis) of a ~34 kb duplicated chromosomal region (x-axis) that encodes, among others, genes of the pyoverdine pathway (bottom).

