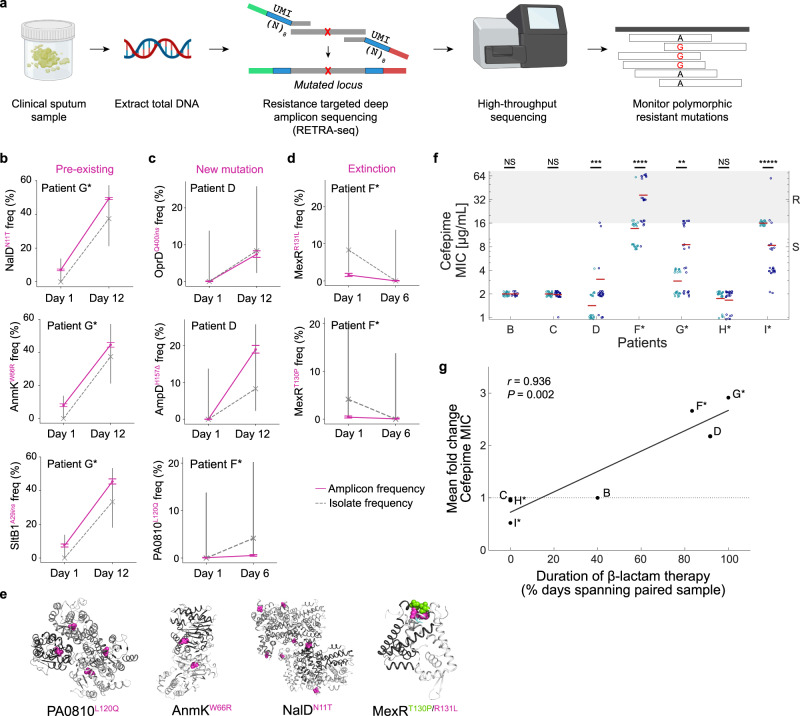
Fig. 4. Treatment-associated dynamics of low-frequency resistance mutations.
a Workflow of resistance-targeted deep amplicon sequencing (RETRA-Seq) as a diagnostic for monitoring resistance mutation frequencies. Total DNA is extracted from clinical sputum and prepared as sequencing libraries via PCR using primers that contain sequencing adapters (green, red) and unique molecular identifiers (UMIs; blue) composed of 8 degenerate nucleotides (N). Amplicon libraries are sequenced on a next-generation sequencing platform and aligned to a reference genome to determine polymorphic frequencies. Images created with BioRender.com. b–d Mutation frequencies (y-axis) across time (x-axis) of select resistance loci within each patient, measured by RETRA-Seq (solid pink) and by the fraction of culture-based isolates (dashed gray). Axis labels (y-axis) indicate the gene name and the mutation type (pink superscript): non-synonymous substitution, insertion (ins), or deletion (Δ). Error bars: Wilson Score interval of UMI counts (amplicon sequencing) or discrete counts (isolate sampling; Methods). Three types of changes in resistance frequencies: expansion of pre-existing mutations that were undetected by culture-based assay (b), expansion of presumed de novo mutations (c), and extinction of mutations (d). e Select non-synonymous mapped on protein structures of homologs of PA0810 (Protein Data Bank ID: 3UMC), AnmK (3QBW), NalD (5DAJ), and MexR (3ECH). Shades of gray indicate distinct monomers and pink/green spheres indicate mutated residues. f Distribution of cefepime MIC (µg/mL; y-axis) in individual isolates (dots) from day 1 (teal) and follow-up (dark blue) sputum samples, with mean value (horizontal read line). Ranges of resistance/intermediate susceptibility (R; gray) and sensitive (S; white) shown on the right and by background color, according to breakpoints defined by the Clinical Laboratory Standards Institute (CLSI). Significance (two-sided Mann–Whitney test): P = 7.5 × 10⁻⁴ (patient D), P = 2.2 × 10⁻⁵ (patient F), P = 0.004 (patient G), P < 10−5 (patient I). NS – not significant. g Relationship between cefepime resistance and clinical history of patient therapy. Fold change in mean cefepime MIC (y-axis) vs. the duration of β-lactam antibiotics administered to each patient during the study period (x-axis), shown for serially sampled patients (dots). Pearson’s correlation (two-sided), r = 0.936, P = 0.002.

