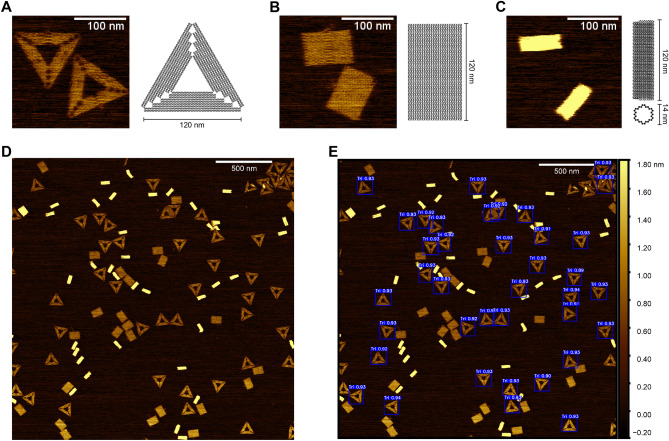
Figure 1.
Structure schematics and sample image pre- and post-detection. Image examples of the three structures used, along with accompanying ribbon diagrams. Examples include: (A) the sharp triangle, (B) breadboard, and (C) nanotube architectures. (D) Selected example of a test image pre-detection containing all three architectures. (E) Selected example of the test image post-triangle detection. The blue bounding box masks are output by the YOLOv5s model representing identified triangles. Size bars in panel (A–C) are 100 nm. Size bars in (D,E) are 500 nm.

