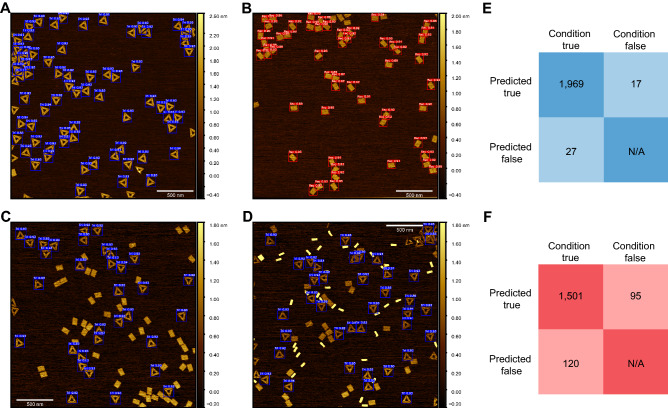
Figure 3.
Model activation in response to geometric diversity. Selected images of different sample populations post-detection. (A) Homogenous triangle population post-triangle detection. (B) Homogenous breadboard population post-breadboard detection. (C) Heterogeneous sample population of triangle + breadboard post-triangle detection. (D) Heterogeneous sample population of triangle + breadboard + nanotube post-triangle. (E) Confusion matrix representing predictions made by the triangle classifier on the entire test set. (F) Confusion matrix representing predictions made by the breadboard classifier on the entire test set. Scale bars in panel (A–D) are 500 nm.

