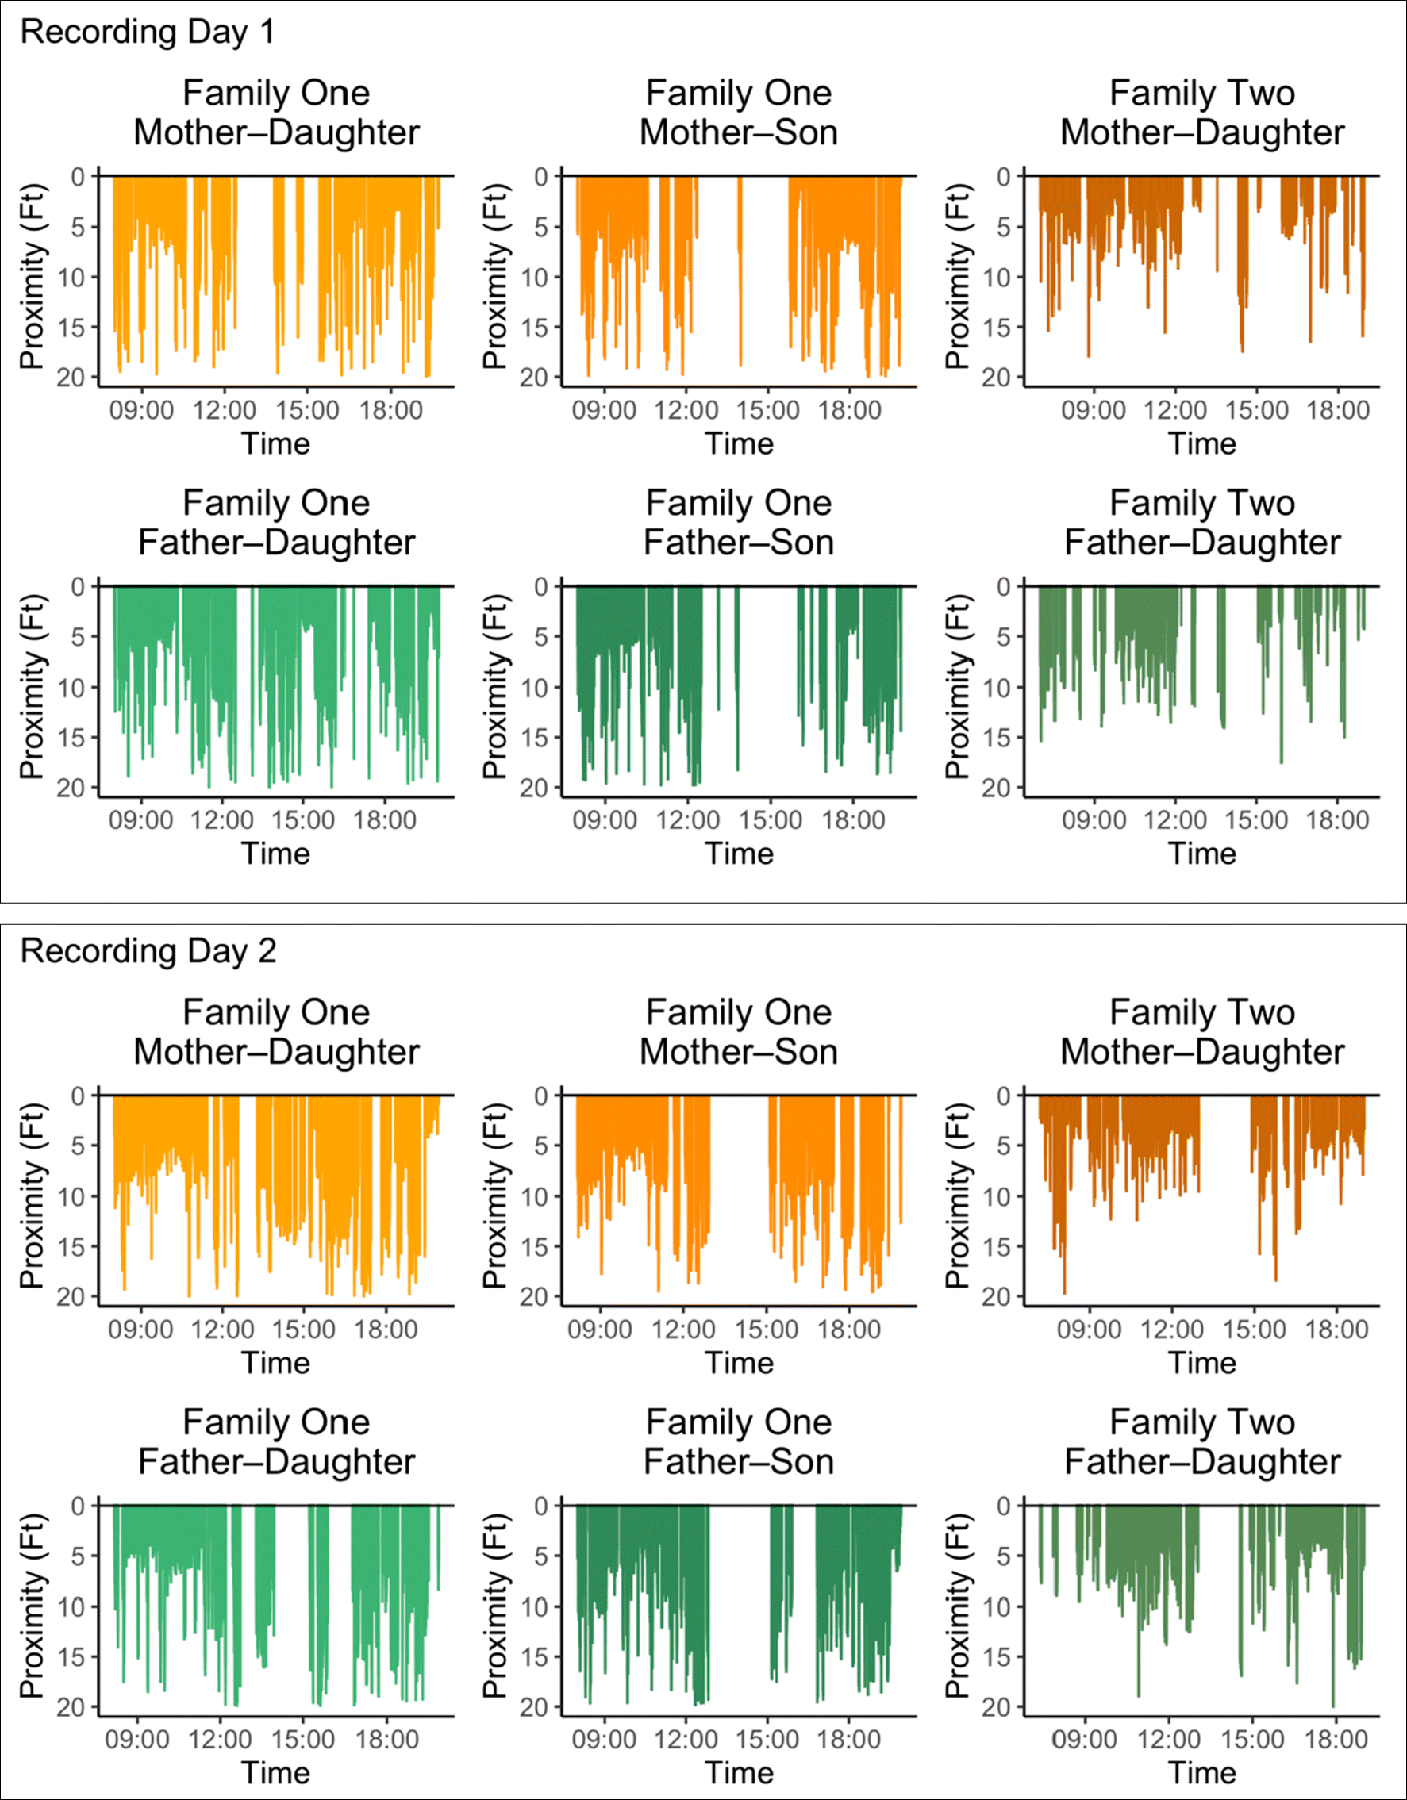
Fig. 3.

Observed proximity between caregiver–child dyads on each family’s first (top box) and second (bottom box) recording days. Colored bars represent observed proximity (ft) between dyad members at a given point in time (one second observations), with closest proximity at the top of the y-axis and distance between the dyad increasing down the y-axis. Plots in orange depict mother–child dyads and plots in green depict father–child dyads. Periods with no data plotted (white space) indicate moments when the dyad was ‘out of range’ of each other.
