
Fig 5.
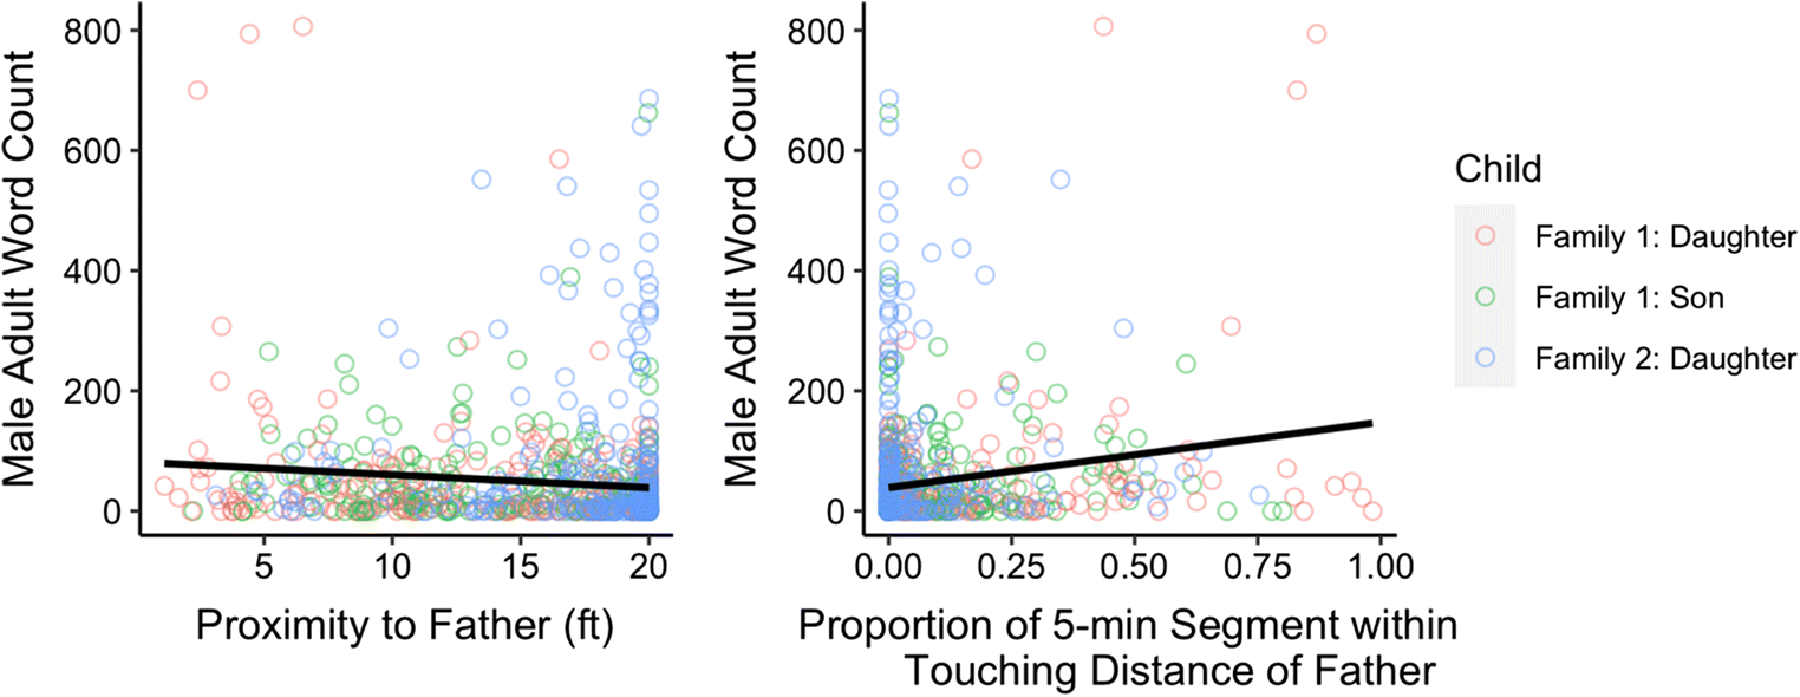
Associations between proximity and language exposure within father–child dyads. The x-axis in the left plot represents the average father–child proximity (feet) within each 5-minute segment. The x-axis in the right panel represents the proportion of the 5-minute segment the child was within touching distance (3 feet) of their father. Both x-axes represent the sum estimated male adult words a child heard within each 5-minute. Each circle represents one 5-minute segment, and circle color represents the specific child whose data is being illustrated. Black lines represent the slope of the bivariate association.