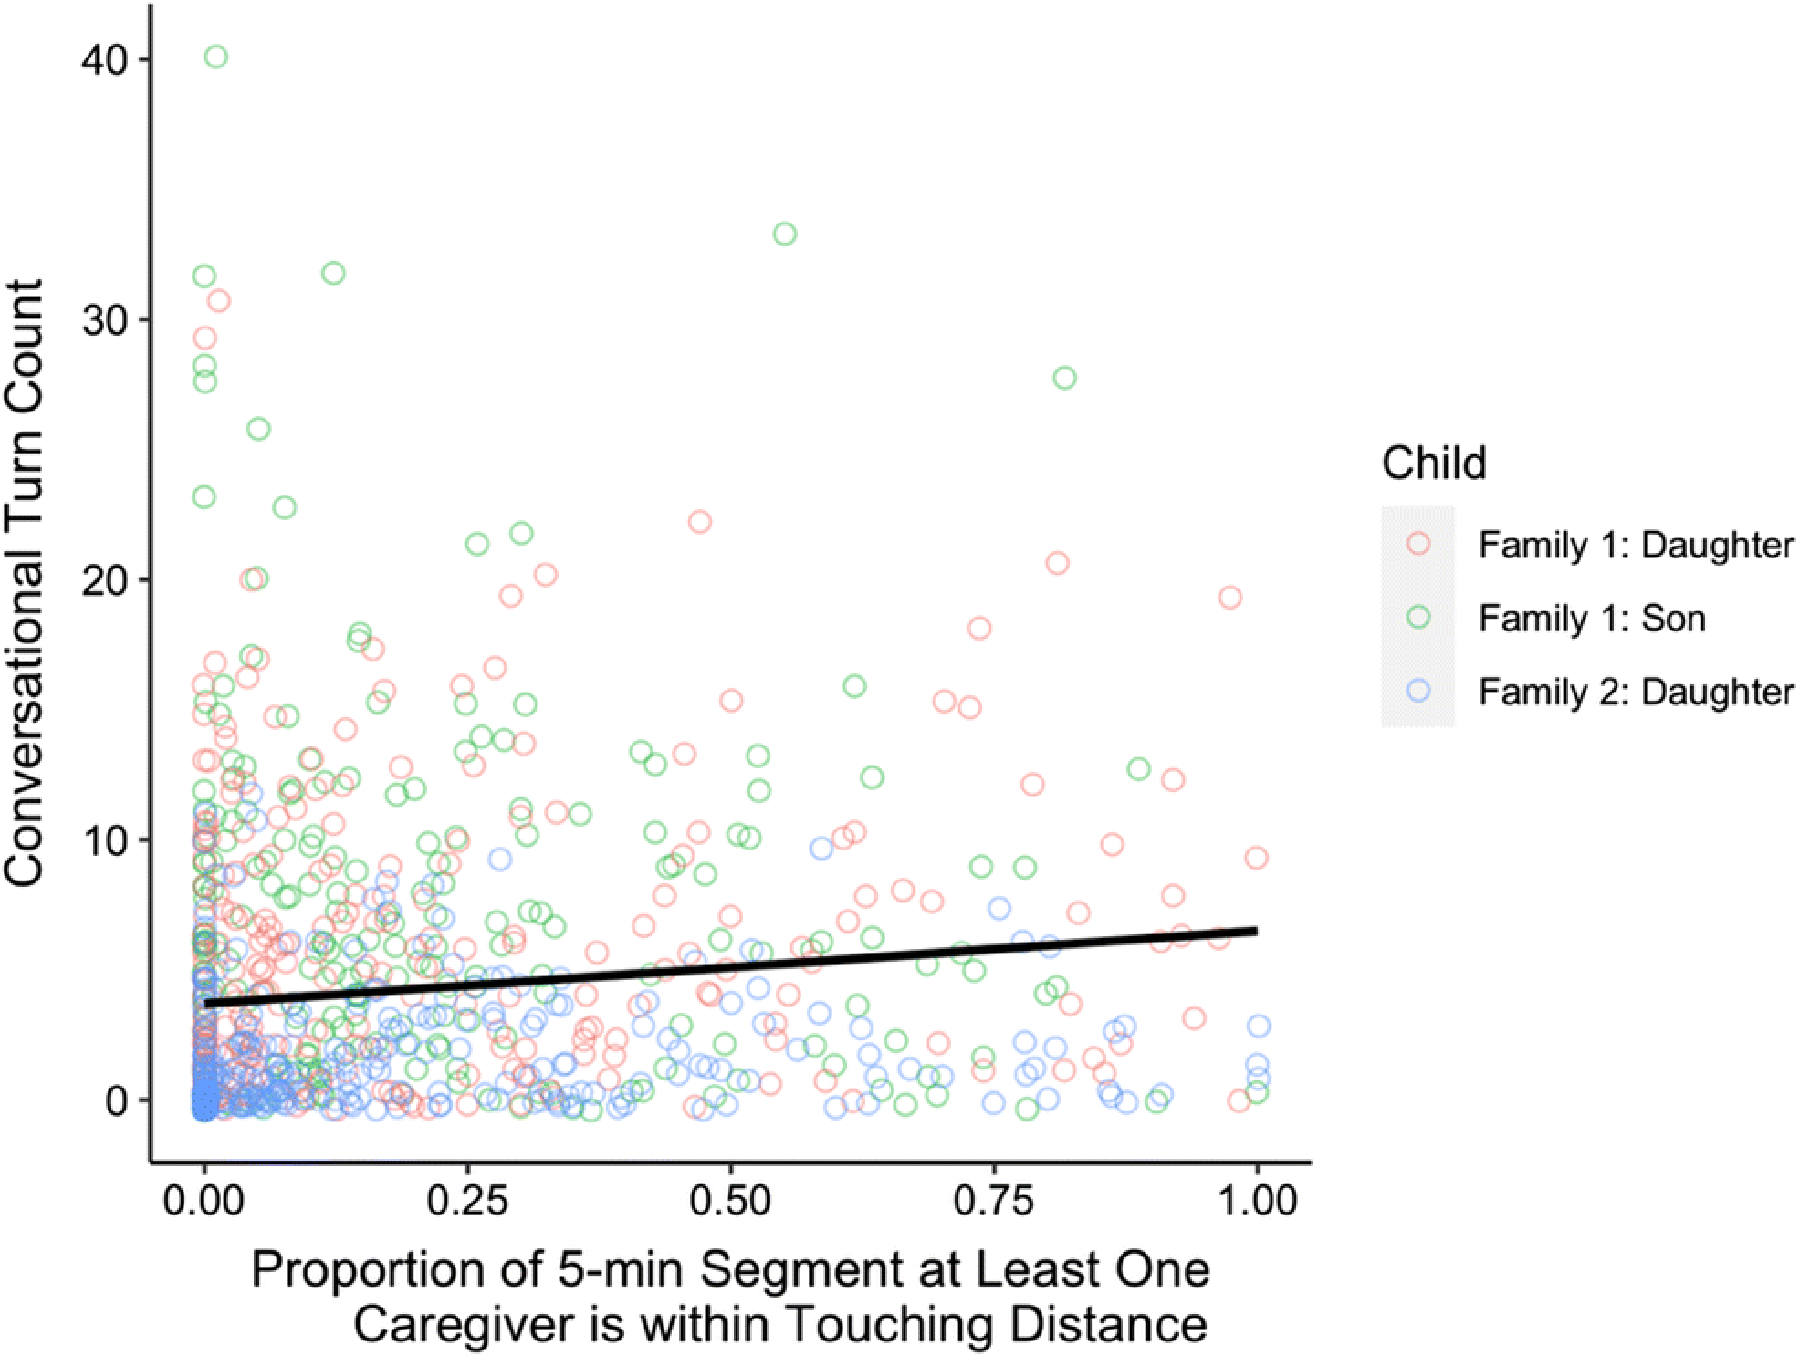
Fig. 6.

Association between the proportion of time at least one caregiver was within touching distance and conversational turns. The x-axis represents the proportion of the 5-minute segment the child was within touching distance of at least one parent. The y-axis represents the estimated number of conversational turns the child was engaged in within each 5-minute. Each circle represents one 5-minute segment, and circle color represents the specific child whose data is being illustrated. The black line represents the slope of the bivariate association.
