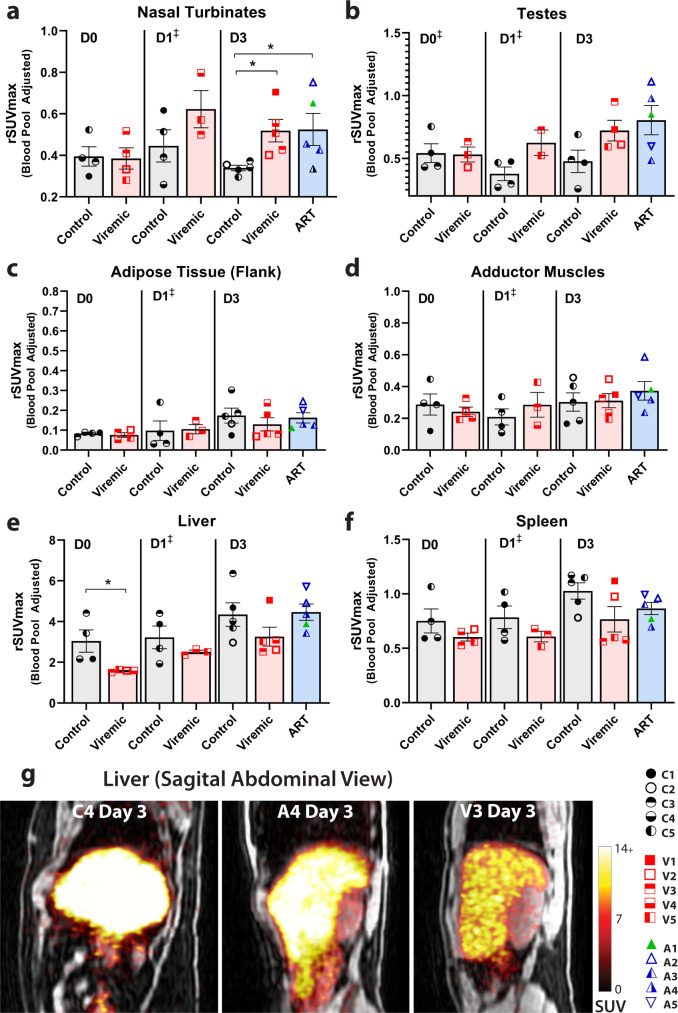
Fig. 5. 89Zr-VRC01 uptake in various tissues.
rSUVmax values for a nasal turbinates, b testes, c adipose tissue (right flank), d adductor muscles (thigh), e liver and f spleen from 3-dimensional gating at imaging day 0, day 1, and day 3 are shown. Representative coronal PET-MR images showing tracer uptake liver as shown in g. 89Zr-VRC01 uptake was higher in viremic and ART-suppressed participants compared with uninfected controls on imaging Day 3. In contrast, tracer uptake in the liver was higher in uninfected controls (D0) may represents decreased lymphoid tissue and bone marrow distribution compared with participants with HIV. SUV standardized uptake value; rSUV blood pool-adjusted 89Zr-VRC01 standardized uptake value (tissue to blood pool SUV ratio); P values <0.05 and <0.01 represented by * and **, respectively from two-sided non-parametric analyses (Mann–Whitney tests for analyses involving two groups and Kruskal–Wallis tests for analyses involving three groups). Mean and standard error bars are shown. Control N = 4 on day 0 and day 1, viremic case N = 4 and 3 on day 0 and day 1, respectively (‡statistical analyses not performed on day 1 as one viremic participant missed this visit). Control and viremic and ART case N = 5 on day 3. Source data are provided as a Source Data file.

