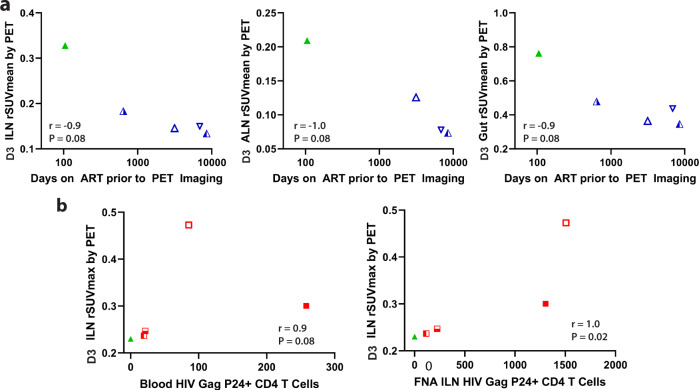
Fig. 6. Associations between time on ART, HIV p24 protein expression in lymph node CD4 T cells obtained by tissue biopsy, and tracer uptake in various anatomical regions.
Correlations between 89Zr-VRC01 rSUVmean in lymph node and gut tissues on imaging day 3 compared with days on ART for viral suppressed participants are shown in a. b Correlations between 89Zr-VRC01 rSUVmax/mean and the frequency of blood and inguinal lymph node HIV Gag P24+ CD4+ T cells as measured by flow cytometry. r and P values represent results from Spearman correlation analyses. Overall, inverse associations between tracer uptake and ART duration and a significant positive correlation between inguinal lymph node 89Zr-VRC01 uptake and direct measures of HIV protein expression in CD4 T cells from inguinal lymph node sampling were observed. Source data are provided as a Source Data file.

