Fig. 2.
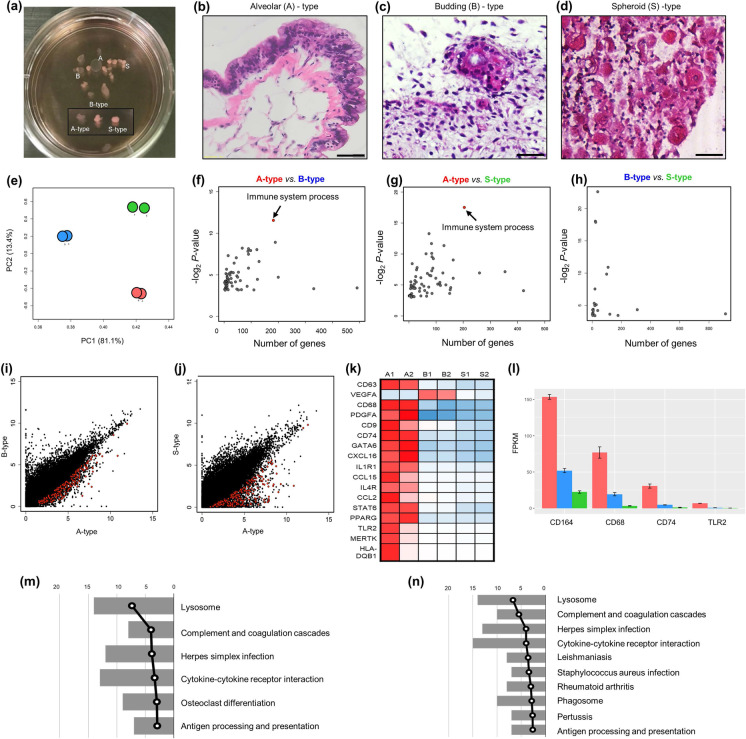
Large-scale transcriptome analyses of alveolar hLOs. a A photograph of floating 3D hLOs showing three different types of 3D hLOs. b–d Hematoxylin and eosin staining displaying the hLO structure. b Alveolar (A) hLOs possessing sac-like structures with thin layer alveolar epithelial type I cells resembling the alveolus inside and smooth muscle (pink) and epithelial cells on the outside. Scale bar = 50 μm. c Budding-type hLOs showing bronchial epithelial cells and bronchiole morphology. d Specific structure was not detected in spheroid (S)-type hLOs. Scale bar = 250 μm. e PCA analysis of three types of hLOs; red, blue, and green colors indicate A-, B-, and S-type hLOs, respectively. f–h Biological process gene ontology analysis of differentially expressed genes identified between (f) A- and B-types, g A- and S-types, and h B- and S-types. i–j Scatter plots of gene expression levels in (I) A- and B-types and (J) A- and S-types; 182 and 204 immune-related genes from (I) and (J) indicated with red dots. k Heatmap of macrophage-related genes. Rows represent individual genes and columns represent individual samples. The high (red), average (white), and low (blue) expression levels are depicted with a color scale. All gene expression levels were normalized by FPKM. (l) The average expression levels of macrophage-specific genes; error bars represent standard errors (n = 2). m–n KEGG pathway analysis of immune-related genes in I (m) and J (n); the bars represent the number of genes and broken lines represent the transformed P values

