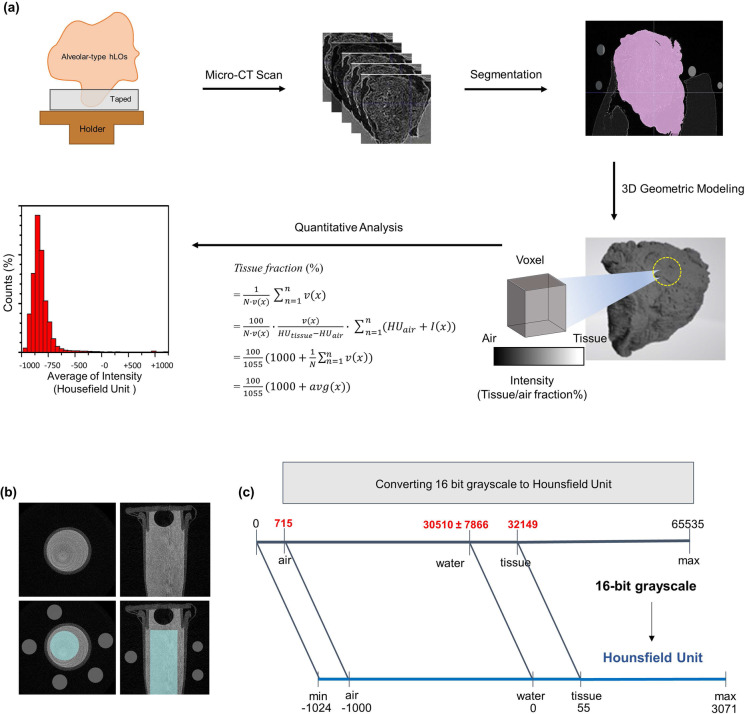
Fig. 5.
Schematic workflow of quantitative micro-CT imaging analysis of alveolar hLOs. a Workflow of micro-CT imaging of alveolar hLOs. The workflow shows alveolar hLO sampling, micro-CT scanning, segmentation, 3D geometric modelling, and quantitative analysis in sequence. The results are presented as the distribution of voxel's HU values. b Axial (left) and coronal (right) view micro-CT images of the water phantom (water in a PCR tube, gray regions) in the upper panels were used to compute mean intensities of water (cyan region inside the tube in the lower panels) and air (small grey circles in the lower panels) for unit conversion from the TIFF to DICOM format. c Chart for converting 16-bit grayscale TIFF to DICOM in HU. The HU values of blank sample (air), water, and tissue are − 1000, 0, and 55, respectively

