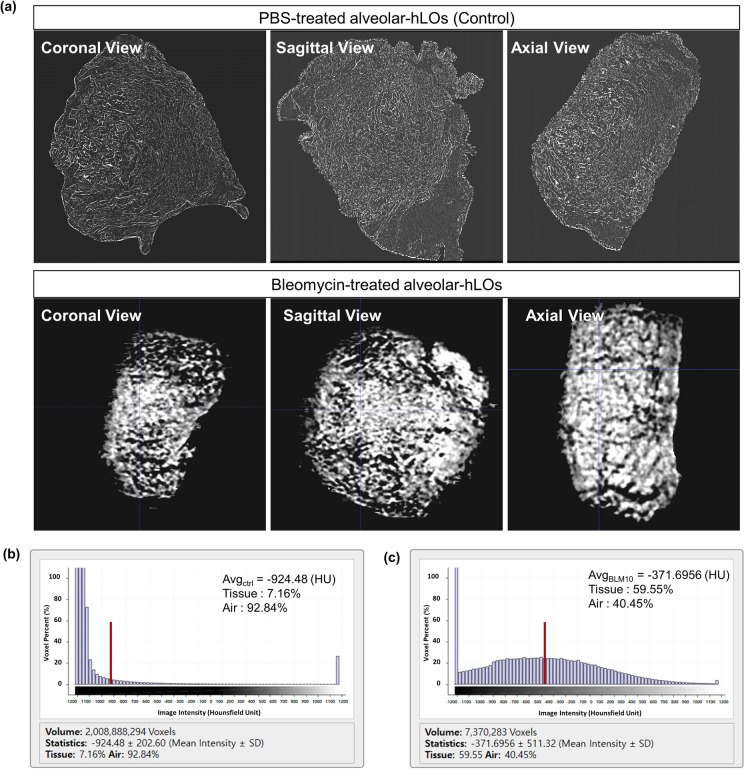
Fig. 6.
Micro-CT image analysis shows an increase in tissue fraction in the alveolar hLOs treated with bleomycin. a 3D views of reconstructed micro-CT images of normal control (upper) and bleomycin-treated (lower) alveolar hLOs. Images were visualized with a central level of − 500 HU and a window of 1500 HU. b CT density (intensity in HU) distribution of the PBS control-treated alveolar hLO micro-CT image. c CT density (intensity in HU) distribution of the bleomycin (10 µg/ml)-treated alveolar hLO micro-CT image. The red bars represent the average HU values for each model

