
FIGURE 2.
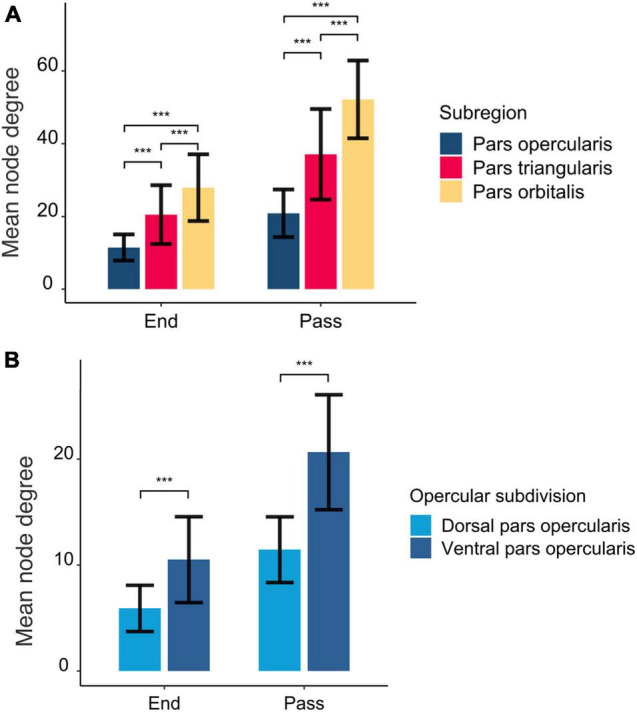
The mean number of interconnected regions seeding from the rIFG subregions (A) and opercular subdivisions (B). End and pass represent whether the tracts were part of an ending or passing fiber pathway. The error bars represent standard deviations. The asterisks above the bars mark statistical significance level at p < 0.001.