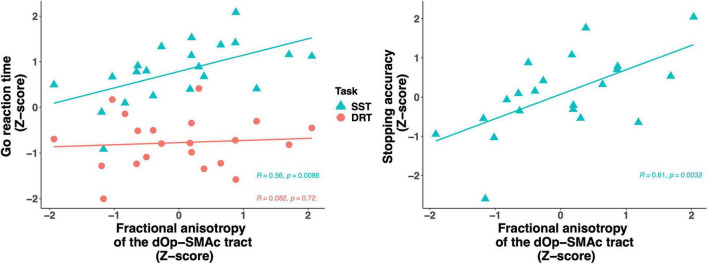
FIGURE 6.
Scatter plot of the fractional anisotropy of the dOp-SMAc tract predicting go reaction time in the stop signal task and the delayed response task (left) and stopping accuracy (right). All variables were z-scored based on the raw values. Go reaction time was scaled across the delayed response task and the stop signal task. dOp, dorsal pars opercularis; SMAc, supplementary motor area complex.

