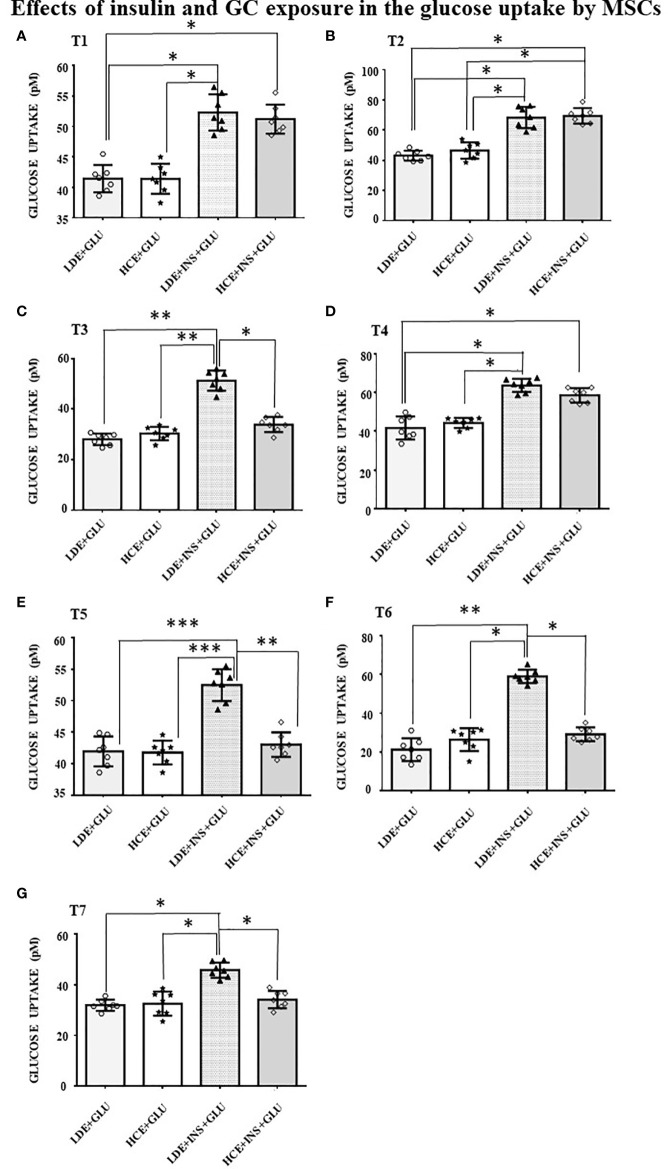
Figure 6.
Glucose uptake in MSCs undergoing a LDE or a HCE to GCs. The bars represent the glucose uptake expressed in pM at T1 (9:50 a.m. first day, A), T2 (1:50 p.m. first day, B), T3 (5:50 p.m. first day, C), T4 (9:50 a.m. second day, D), T5 (1:50 p.m. second day, E), T6 (5:50 p.m. second day, F) and T7(1:50 p.m. third day, G) in MSCs undergoing a LDE or a HCE to GCs and stimulated or not with insulin. One-way ANOVA; *p < 0.05,**p < 0,01,***p < 0,001. LDE+GLU: LDE (Lower and Decreasing Exposure) cells treated with glucose; HCE+GLU: HCE (higher and Constant Exposure) cells treated with glucose; LDE+INS+GLU: LDE cells stimulated with insulin before glucose exposure; HCE+INS+GLU: HCE cells stimulated with insulin before glucose exposure. Data are expressed as mean ± SD of the readings for MSCs derived from each single patient over three independent experiments.

