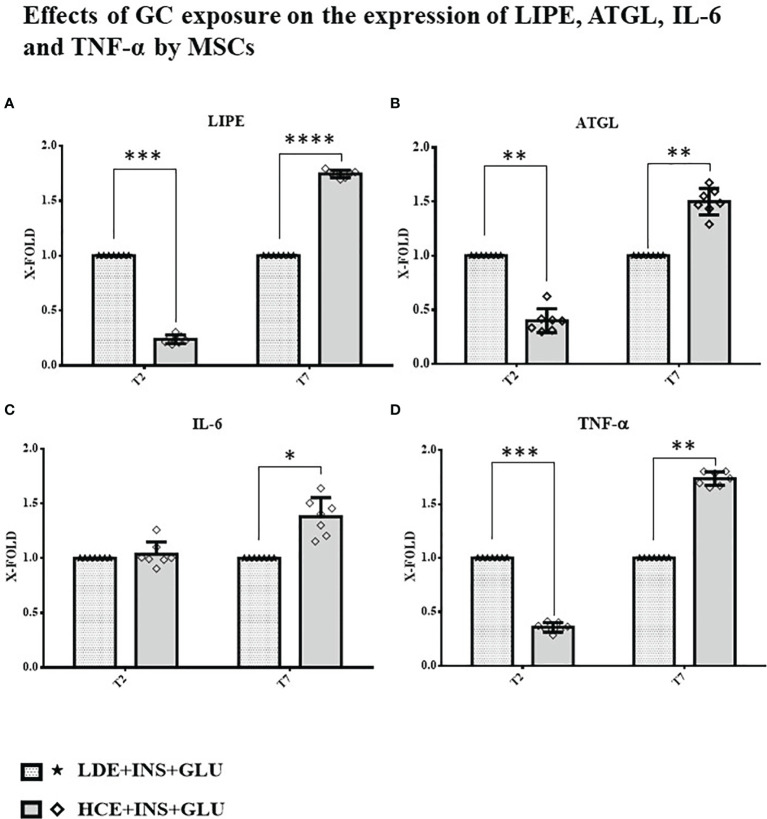
Figure 7.
Gene expression in MSCs undergoing a LDE or a HCE to GCs. The bars display the expression of genes referred specifically to the development of IR: (A): LIPE, (B): ATGL, (C): IL-6 and (D): TNF-α at T2 and T7 sampling times. LDE+GLU+INS: LDE (Lower and Decreasing Exposure) cells stimulated with insulin before glucose exposure; HCE+GLU +INS: HCE (higher and Constant Exposure) cells stimulated with insulin before glucose exposure. Data are expressed as mean ± SD (over three independent experiments) of the X-fold (2−ΔΔCt method) of HCE+INS+GLU compared to LDE+INS+GLU arbitrarily expressed as 1, where ΔCt=Ct (gene of interest)—Ct (control gene) and Δ (ΔCt)=ΔCt (HCE+INS+GLU)—ΔCt (LDE+INS+GLU). Unpaired t-Student’s test; *p < 0.05,**p < 0.01,***p < 0.001;****p < 0.0001.

