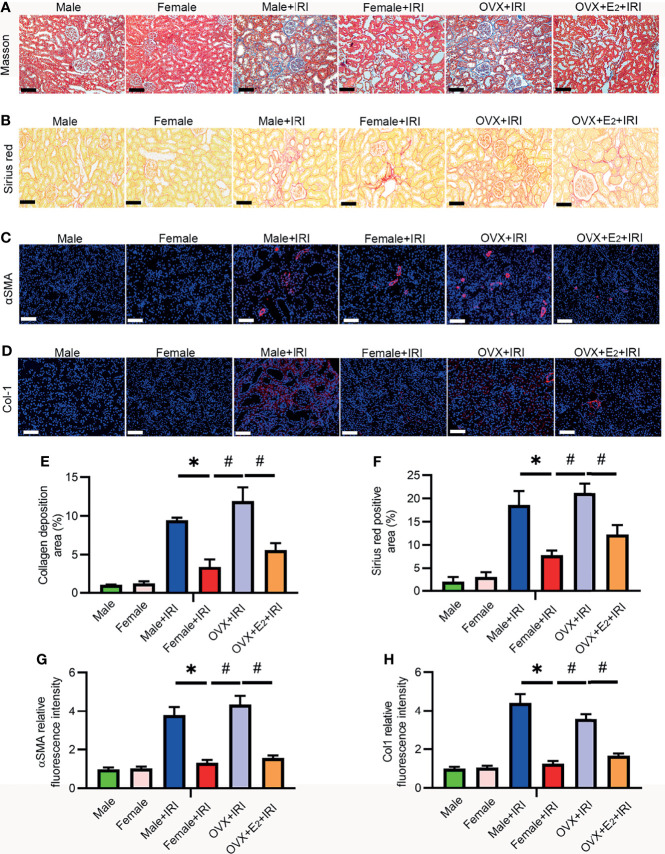
Figure 3.
E2 attenuated renal fibrosis induced by IRI. (A) Representative sections of kidney tissues from female rats stained with Masson’s trichome (A) to examine changes in interstitial fibrosis (collagen stained in blue) and a histogram showing the statistical analysis (E). One-way ANOVA followed by Bonferroni’s post-hoc test, * p < 0.05, vs. female+IRI. # p < 0.05, vs. OVX+IRI. Bar = 100 μm. (B) Representative sections of kidney tissues from different rats stained with Sirius red (B) and a histogram showing the statistical analysis (F). One-way ANOVA followed by Bonferroni’s post-hoc test, * p < 0.05, vs. female+IRI. # p < 0.05, vs. OVX+IRI. Bar = 50 μm. (C) Immunofluorescence staining of α-SMA (red) and DAPI (blue) (C) in representative sections of kidney tissues from female rats and a histogram showing the statistical analysis (G). One-way ANOVA followed by Bonferroni’s post-hoc test, * p < 0.05, vs. female+IRI. # p < 0.05, vs. OVX+IRI. Bar = 100 μm. (D) Immunofluorescence staining of Col1 (red) and DAPI (blue) (D) in representative sections of kidney tissues from female rats and a histogram showing the statistical analysis (H). One-way ANOVA followed by Bonferroni’s post-hoc test, * p < 0.05, vs. female+IRI. # p < 0.05, vs. OVX+IRI. Bar = 100 μm, n = 6 in each group. The data are presented as the mean ± SEM.

