
Figure 5.
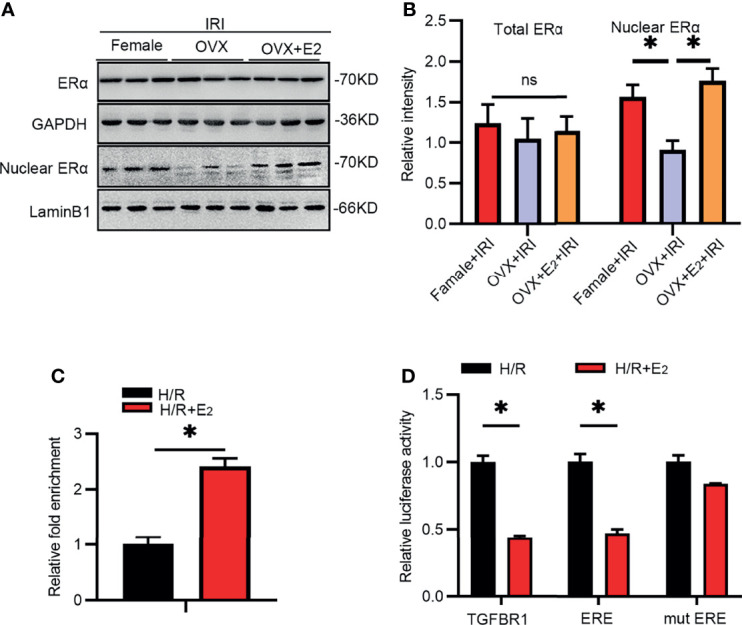
IRI activated TGF-βRI by suppressing ERα. (A) Total and nuclear extracts from kidney tissues of rats in the different groups as analyzed by antibodies against ERα (A) and a histogram showing the statistical analysis (B). One-way ANOVA followed by Bonferroni’s post-hoc test, * p < 0.05, vs. OVX+IRI. (C) ChIP was used to analyze the predicted binding sites in the promoter region of TGF-βRI after treatment with H/R with or without E2 in NRK-52E cells for 24 h. Unpaired t-test, * p < 0.05, vs. H/R+E2. (D) Luciferase activity after transfection of pGL3-basic plasmids encoding the TGF-βRI promoter, ERE, or mut ERE sequence after treatment with H/R with or without E2 for 24 h. Unpaired t-test, * p < 0.05, vs. H/R+E2, n = 3 in each group. ns, non significance. The data are presented as the mean ± SEM.