
Figure 5.
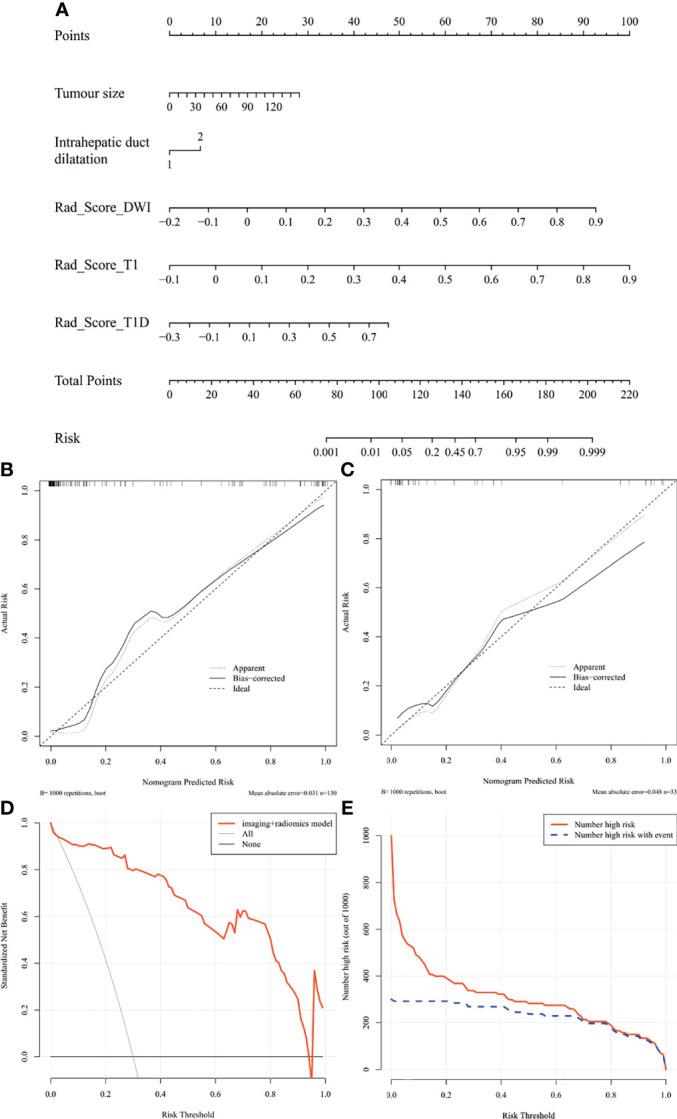
Nomogram of MVI prediction model, calibration curves of the nomogram in the training and validation cohort, decision curve, and clinical impact curve in the overall ICC patients. (A) A nomogram integrates imaging factors including tumor size and intrahepatic duct dilatation, and radiomics factors includes Rad-scores of diffusion-weighted images, precontrast T1-weighted images, and delayed phase images. (B, C) Calibration curves of the nomogram in the training and validation cohort. x-axis is a nomogram-predicted risk of MVI. y-axis is actual risk of MVI, and the diagonal dashed line indicates the ideal prediction by an ideal model. (D) Decision curve for the nomogram in the overall patients. The gray line is the net benefit of assuming that all patients have MVI; the black line is the net benefit of assuming no patients have MVI; and the red line is the expected net benefit of per patient based on the nomogram. (E) Clinical impact curve for the nomogram in the 1,000 simulated samples. The blue dashed line is the actual number of high risk, and the red line is the number of high risk based on nomogram.