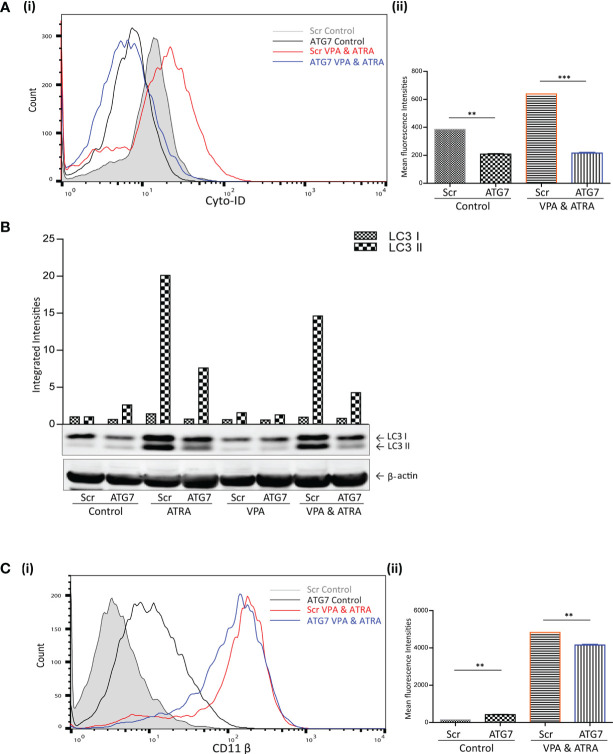
Figure 3.
ATG7 knockdown attenuated valproic acid (VPA) & all-trans-retinoic acid (ATRA)-induced autophagy and differentiation. ATG7 was knocked down in NB4 cells using lentiviral transduction of target-specific short hairpin (sh)RNA (ATG7). NB4 cells were also transduced with an off-target scrambled shRNA (Scr). Both cell lines were treated with either ATRA (1 μM) or VPA (1mM) alone or a combination of both for 72 hours. (A) (i) Cyto-ID was used to assess autophagosome content in control untreated Scr (grey histogram), untreated ATG7 knockdown (black overlay), VPA&ATRA treated Scr (red overlay) and ATG7 knockdown (blue overlay) cell lines. (ii) Data from three independent experiments is presented in the graph to the right, as mean fluorescence intensities ± SEM ***p < 0.0005, **p < 0.005. (B) Western blot analysis of LC3II levels in Scr and ATG7 knockdown cells, following treatment with ATRA, VPA or a combination of both. All bands were quantified using the Odyssey Infrared Imaging System (Li-COR), normalised to ß-actin and presented as integrated intensities, with all bands normalised to Scr untreated control cells (lane 1). For all western blots, integrated intensities are representative of three independent experiments (n = 3). (C) (i) The induction of differentiation was assessed by measuring expression of surface CD11β by flow cytometry in untreated Scr (grey histogram), untreated ATG7 KD (black overlay), and VPA&ATRA treated Scr (red overlay) and ATG7 KD (blue overlay) cells. A single representative histogram is shown, with mean fluorescence intensity ± SEM presented in graph to the right (ii) (n = 4) **p < 0.005.

