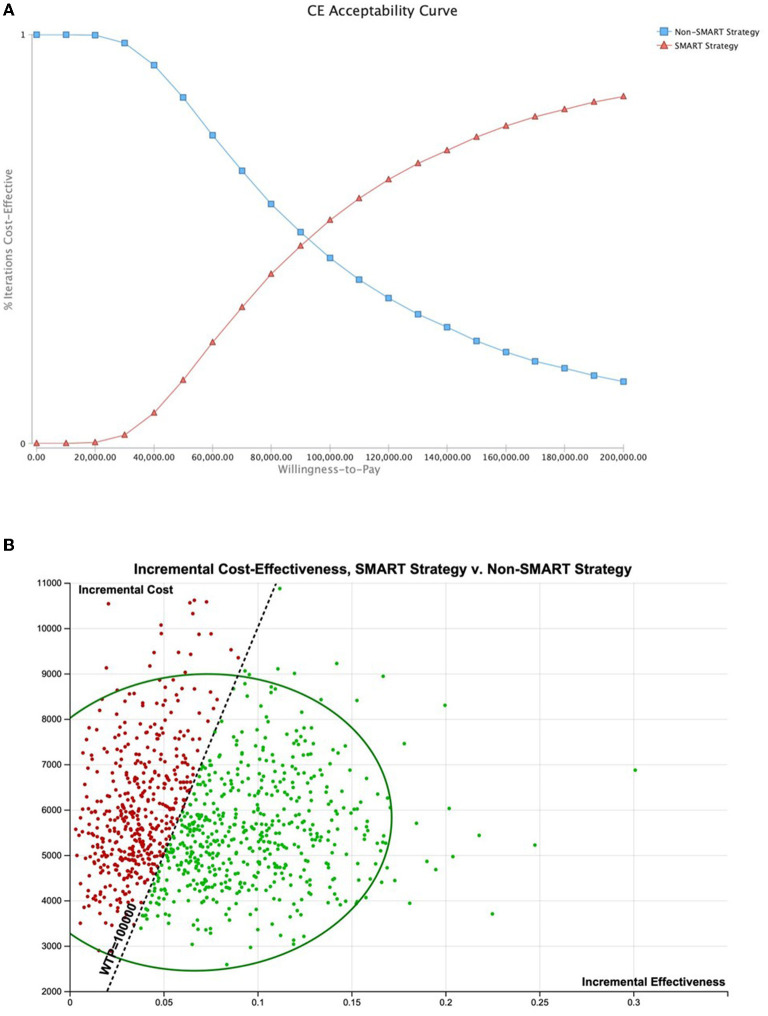
Figure 5.
Probabilistic sensitivity analysis. Probabilistic sensitivity analysis using triangular distributions (n = 10,000 simulations, assuming an average 1.5% annual SCA risk with upper and lower limits of 0.1%–6.0%) demonstrated SMART to be the most cost-effective strategy in 54.64% of simulations (WTP, $100,000 per QALY). (A) Cost-effectiveness acceptability curve. (B) Cost-effectiveness of 10,000 simulations shown with 95% confidence ellipse.

