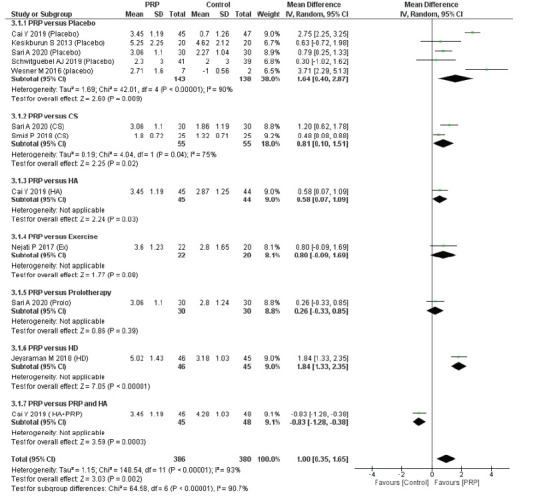
Fig. 3.

Forest plot of the included studies pooled using a random-effects model to assess medium-term (6–7 months) pain relief: comparison between PRP injections and control interventions. The forest plot was acquired from meta-analyses of detailed data about differences in visual analog scale pain scores. The vertical line indicates no difference between the intervention groups. PRP: platelet-rich plasma, SD: standard deviation, IV: inverse variance, CI: confidence interval, CS: corticosteroid, HA: hyaluronic acid, Ex: programmed exercise therapy, HD: hydro-dissection, HA+PRP: combination of hyaluronic acid and platelet-rich plasma.
