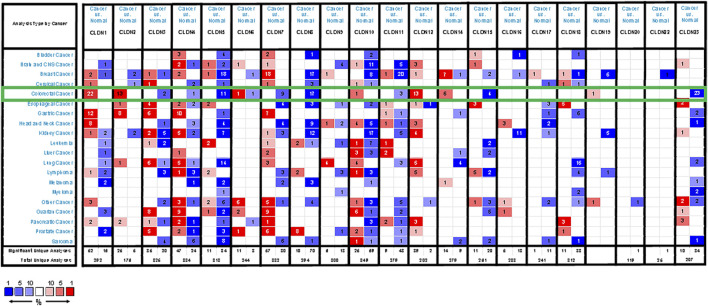
FIGURE 1.
CLDN family member expression levels across human cancers. Cut-off values for these mRNA analyses were as follows: p-value = 0.01, Fold-change = 1.5, gene rank = 10%. Red and blue correspond to overexpression and underexpression, respectively, with the strength of the color be proportional to the expression level for that gene.

