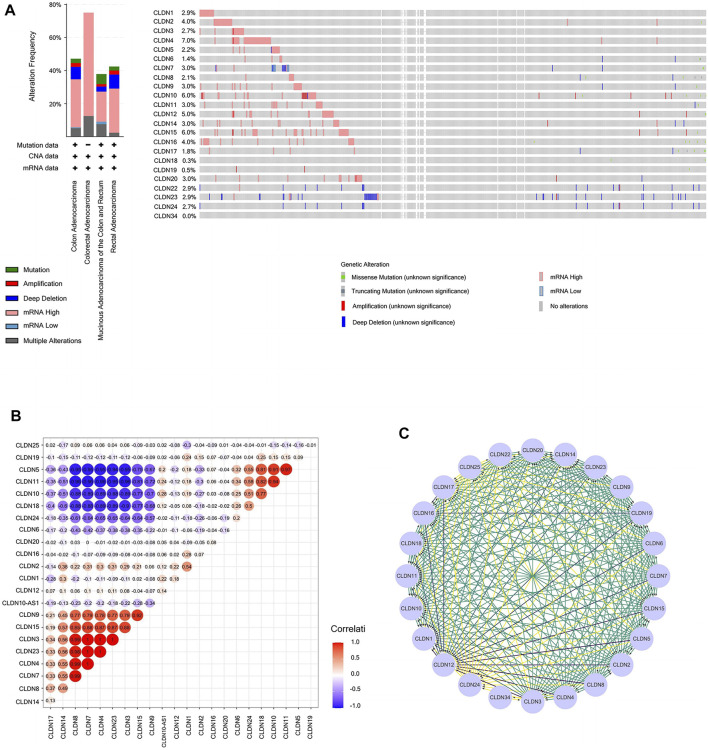
FIGURE 9.
(A) Cancer type summary and Oncoprint for CLDN family genes in BioPortal. (B) Heatmap demonstrating correlations among CLDN family genes with respect to mRNA expression. Colors correspond to Pearson correlation coefficients, which span from blue to red (negative and positively correlated, respectively). (C) A PPI network of CLDNs was generated using the STRING database to clarify interactions among these proteins.

