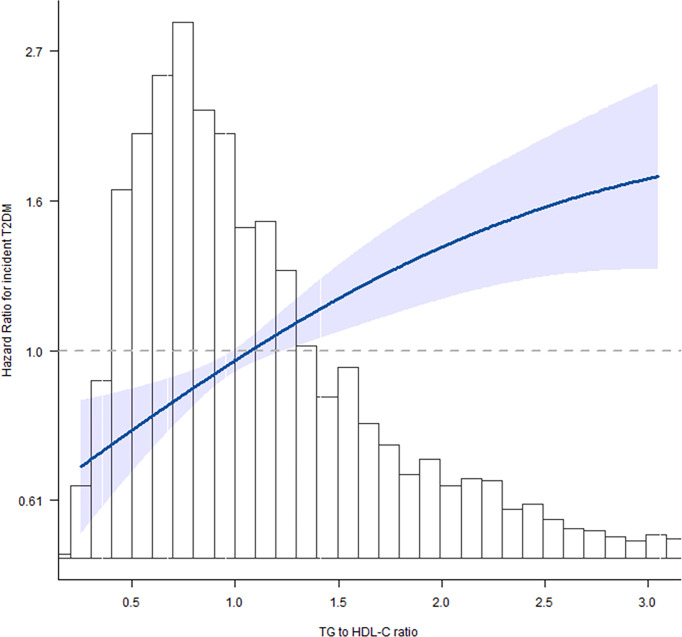
Figure 2.
Spline graphical representation of the relationship between triglyceride to high-density lipoprotein cholesterol (TG/HDL-C) ratio and incident T2DM in the multivariable-adjusted model (model II). The restricted cubic splines showed a dose–response relationship between TG/HDL-C ratio variability and incident diabetes. With the increase of TG/HDL-C ratio, the hazard ratio (HR) of incident T2DM gradually increased and showed a curvilinear correlation.

