
FIGURE 4.
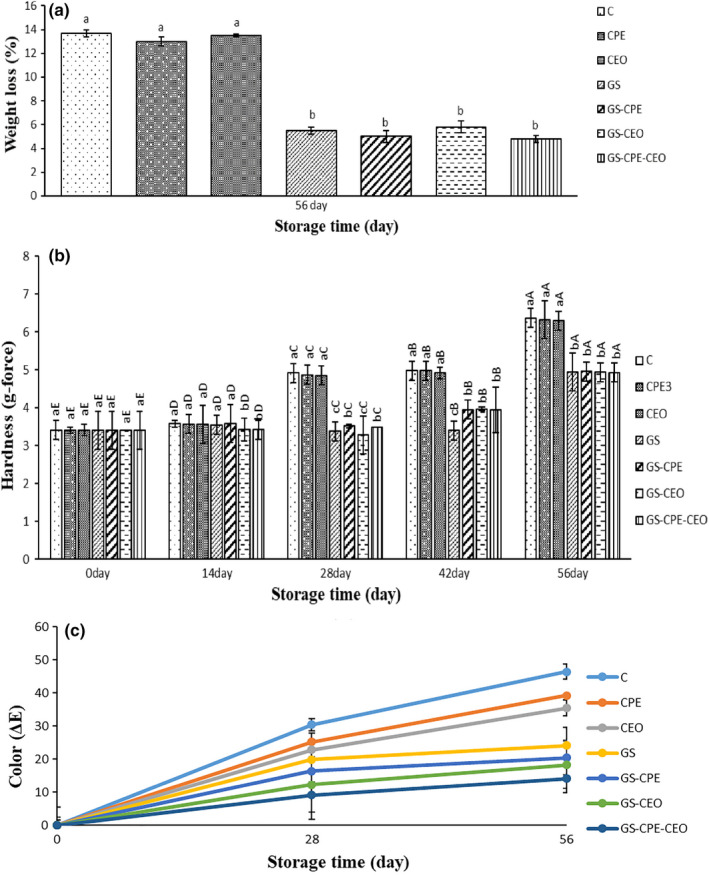
Average changes in weight loss (a), hardness (b), and color (c) of the cheese slices during storage at 4°C. The significance of the acronyms is the same as in Figure 3. Different letters within the same interval (day) (a, b, c, etc.) and the same treatment (A, B, C, etc.) indicate a statistically significant difference (p ≤ .05)