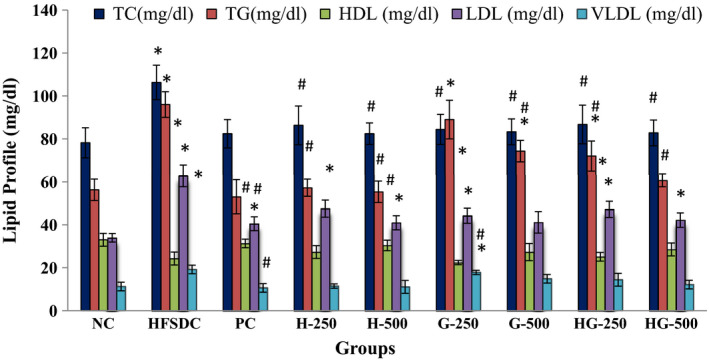
FIGURE 2.

Effect of treatment on the lipid profile of different rat groups. HDL, high‐density lipoprotein; LDL, low‐density lipoprotein; TC, total cholesterol; TG, triglycerides; VLDL, very low‐density lipoprotein. *Significant (p ≤ .05) difference compared with NC. #Significant (p ≤ .05) difference compared with HFSDC among all the groups
