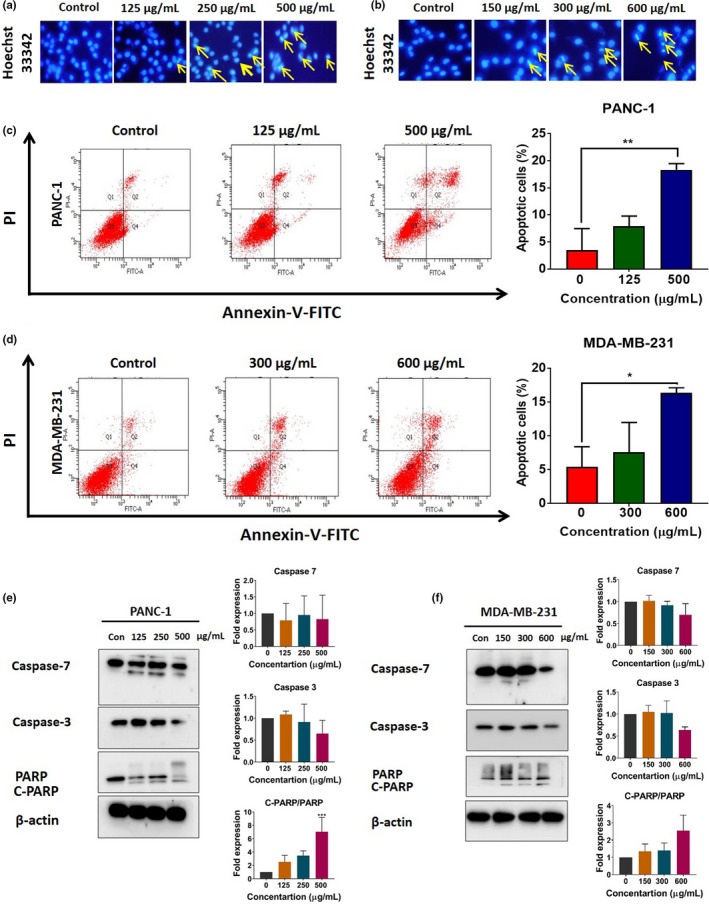
FIGURE 7.

Hoechst 33342 staining of PANC‐1 (a) and MDA‐MB‐231 cells (b). Yellow arrows in Hoechst 33342‐stained cells indicate condensed chromatin. Representative flow cytometry plots obtained using Annexin V‐FITC/PI staining to assess apoptosis in PANC‐1 (c) and MDA‐MB‐231 cells (d) following exposure to HE for 48 h. Western blot analysis of the expression of apoptosis‐related proteins in PANC‐1 (e) and MDA‐MB‐231 cells (f) exposed to HE for 48 h. Representative bands for caspase 7, caspase 3, full PARP, and cleaved PARP (C‐PARP) are shown on the blots. Statistical comparison among groups was carried out using one‐way ANOVA with Dunnett's post hoc test. *p < .05 and **p < .01 compared to untreated cells (n = 3)
