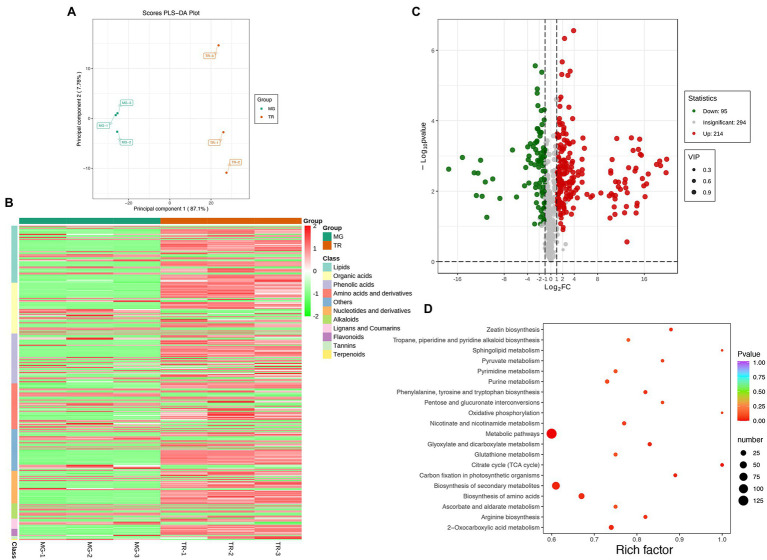
Figure 2.
Preliminary analysis of metabolomics data of mango fruits. (A) PLS-DA of samples with six biological repetitions at two developmental stages. (B) Heat map of different metabolites in MG and TR. (C) Volcano plot of differential metabolites for TR vs. MG. Each point in the figure represents a metabolite. Green points represent downregulated metabolites, red points represent upregulated metabolites, and gray points represent metabolites that were detected but not significantly different. (D) Pathway enrichment analysis of differential metabolites for TR vs. MG. The color of the point represents p, and the size of the point represents the number of differentially enriched metabolites.

