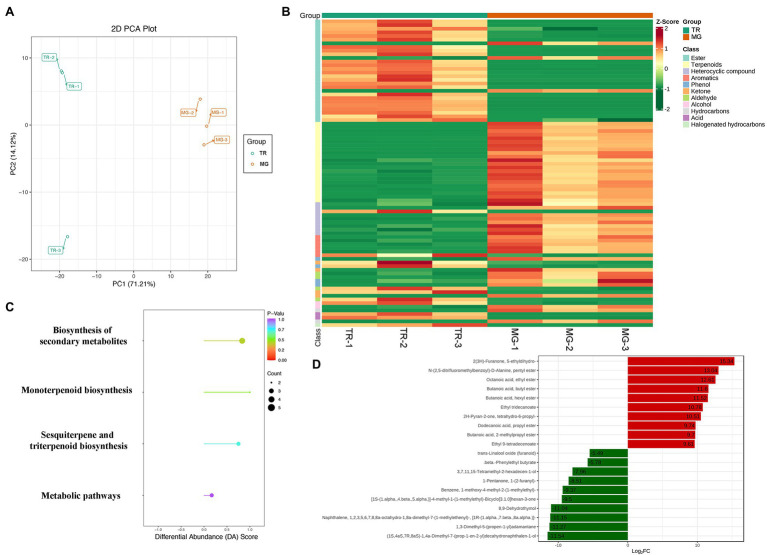
Figure 3.
Metabolome analysis of volatile compounds in mango fruits. (A) PCA of samples with six biological repetitions at two developmental stages. (B) Heat map of different volatile metabolites in MG and TR. (C) KEGG pathway enrichment analysis of differential volatile metabolites for TR vs. MG. (D) Significantly differentially accumulated volatiles with VIP ≥ 1, value of p < 0.01, and |Log2FC| ≥ 4.

