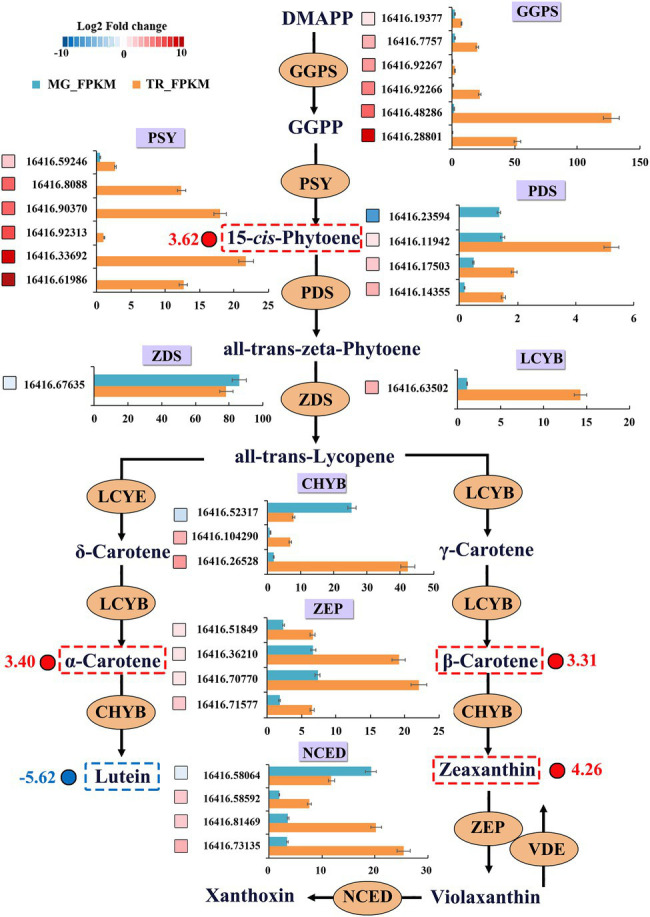
Figure 5.

DEGs and differential metabolites of carotenoid-biosynthesis pathway in mangoes. DEGs were recruited by |Log2FC| ≥ 1. Blue and red boxes indicate downregulated and upregulated transcripts, respectively. Grids with 10 different gray-scale levels show the Log2FC value, with the Log2FC values 0–1, 1–2, 2–3, 3–4, 4–5, 5–6, 6–7, 7–8, 8–9, and 9–10 represented by gray-scale levels 1–10, respectively. X-axis represents the transcript value of FPKM. Expression patterns of differential metabolites are indicated at the side of each metabolite.
