
TABLE 3.
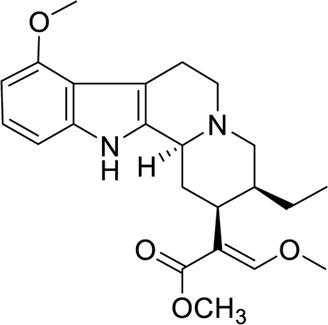
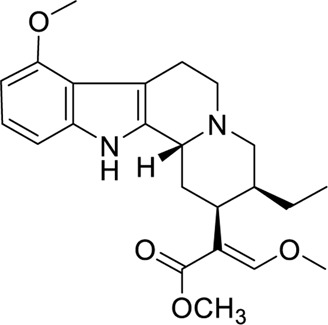
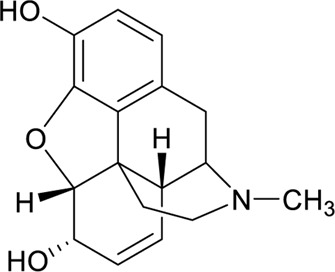
Opioid Agonistic Activity of Mitragynine (1), Speciociliatine (3), and Morphine in Electrically Stimulated Guinea-Pig Ileum Preparation.
| Compound | Structure | a pD2 value | b Relative potency (%) | c Relative inhibitory activity (%) |
|---|---|---|---|---|
| Mitragynine (1) |
|
6.95 ± 0.12 | 26 | 95 |
| Speciociliatine (3) |
|
5.40 ± 0.07 | 2 | 101 |
| Morphine |
|
7.17 ± 0.05 | 100 | 100 |
a
pD2 values indicate the potency of agonist, the higher pD2 reflects higher potency of the agonist.
b
Relative potency is shown as a percentage of the pD2 value of the compound against that of morphine.
c
Relative inhibitory activity reflects to the intrinsic activity on opioid receptors, is shown as a percentage of the maximum inhibition by compounds against that by morphine. All data points represent mean ± SEM (µM) of n ≥ 3.