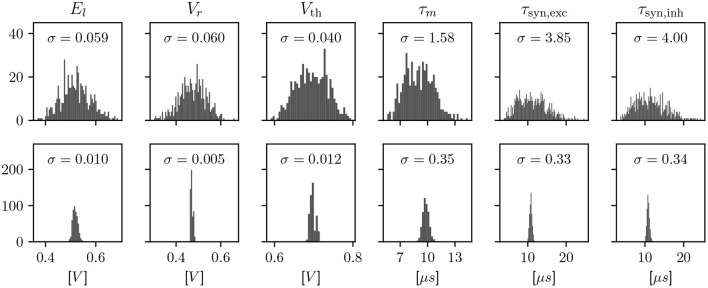
Figure 2.
Histograms showing a characterization of LIF properties of neurons before (top) and after (bottom) calibration. Each histogram shows all 512 neuron circuits on a single ASIC. In the top row, the configuration has been set equal for all neurons, to the median of the calibrated parameters. This results in different model characteristics due to device-specific fixed-pattern noise arising during the manufacturing process. After calibration, the analog parameters, such as bias currents and voltages, are selected such that the observed characteristics match a target.

