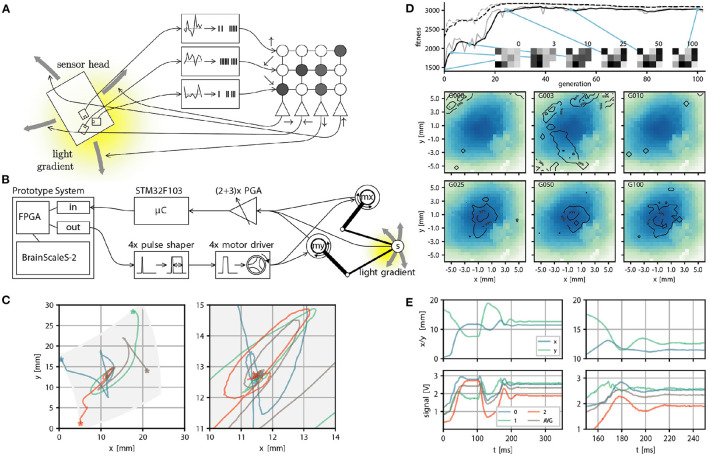
Figure 6.
Real world closed loop interaction with the BrainScaleS-2 system. (A) Conceptual overview of the example experiment, a sensor head with three light sensors is moved over an illuminated surface. Sensor readings are converted into spike input to 3 input sources in a small feedforward spiking neural network. Spike output produced by 4 neurons is converted into motor commands, which move the sensor head on the surface. The goal is to follow the light gradient. (B) Physical realization of the example experiment from right to left: The PlayPen2 consists of two actuated arms which pantographically move a sensor head over a screen or illuminated surface. Signals from the sensor head are digitally processed by a micro controller and converted into spikes send into a FPGA used to interface with a scaled down BrainScaleS-2 prototype system, which implements the small feedforward spiking network. Spike outputs are routed in the FPGA to the Spike I/O interface and converted by pulse shapers into motor command pulses. (C) Example trajectories of the sensor head on the surface, with gray indicating the accessible region (left) and zoom in on the center region where the brightness maximum is (right). (E) Position (top) and brightness signals (bottom) of the sensor head over time. The two panels on the left show the full time course. The neural network starts control at t = 100 ms and stops at t = 250 ms. The two panels on the right show a zoom in on the interval t ∈ [100, 200]ms, with the gray curve indicating an average over all brightness readings. (D) We perform evolutionary optimization of the 4 × 3 weight matrix both from a random initial weight configuration. We show the moving average of the fitness in black and the fitness at a certain generation in gray, both for the top three individuals (dashed line) and the population average (solid line). In addition we display the weight configuration of an arbitrary individual at 6 selected generations (0, 3, 10, 25, 50, and 100). Finally we show a qualitative performance evaluation at the same generations of the average weight matrix over 100 experimental runs divided into 4 starting positions. The contourlines show where 99, 50, and 10% of all trajectories ended after 225 ms, when the maximum brightness should be reached. The contourlines are overlayed over a plot of the brightness sampled from the photo diode signals over all runs and generations. Missing pixels correspond to locations not reached at any time. (A–E) were adapted from Schreiber (2021) and (C) from Billaudelle et al. (2020).

