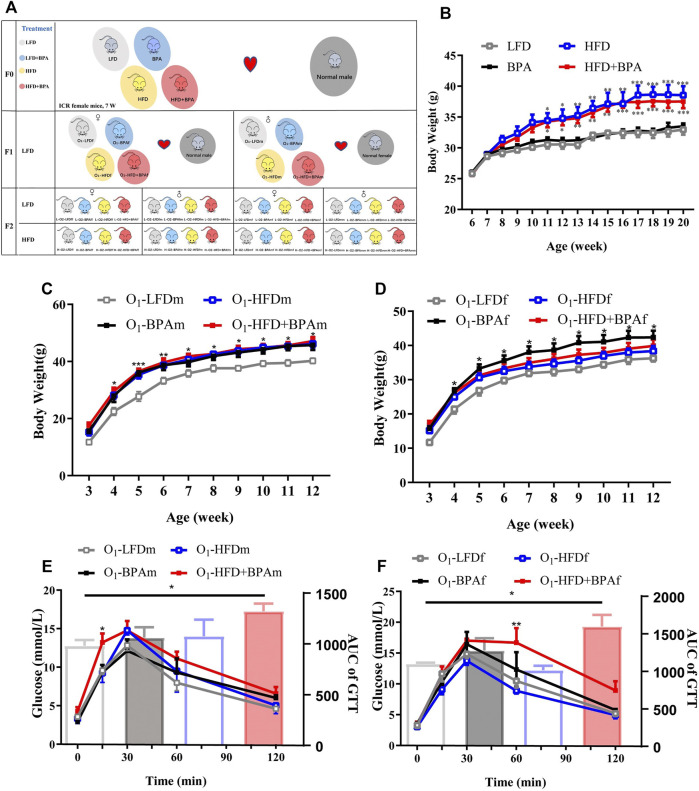
FIGURE 1.
HFD, BPA and their combination affect weight gain, metabolic profile of F0 and F1. (A) Schematic diagram of experimental design and animal groups. (B) The body weight difference of F0 female exposed to LFD, BPA, HFD, and HFD plus BPA. (C,E) Body weight and GTT of F1 male offspring. (D,F) Body weight and GTT of F1 female offspring. Data were presented as mean ± SEM and were analyzed by two-way ANOVA with a post hoc test. *p < 0.05, **p < 0.01, ***p < 0.001, BPA, HFD, BPA + HFD vs. LFD.

