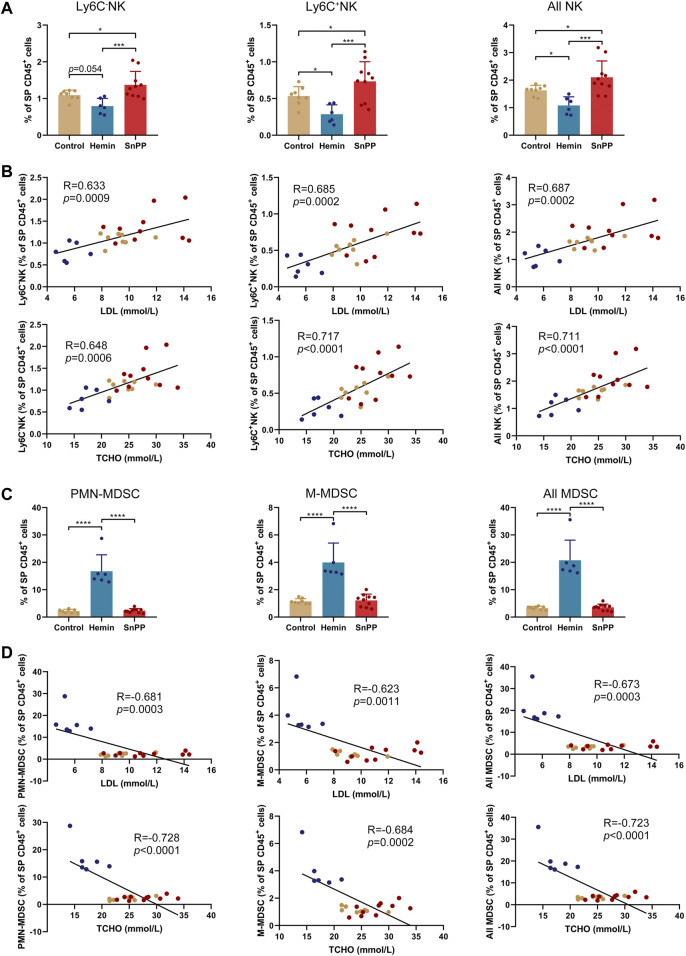
FIGURE 3.
HO-1 inducer and inhibitor affect the NK and MDSC in the spleen. (A) Bar plots showing the frequencies of Ly6C+NK, Ly6C−NK, and all NK cells in spleen (SP) CD45+ cells obtained from ApoE-/- mice treated with hemin or SnPP or vehicle, respectively. (B) Dot plots (n = 24) showing the Pearson correlation coefficients for relationships between the concentrations of total (TCHO) or LDL cholesterol in peripheral blood and the frequencies of indicated NK cell subsets in the spleen. (C) Bar plots showing the frequencies of PMN-MDSCs, M-MDSCs, and all MDSCs in spleen CD45+ cells obtained from ApoE-/- mice treated with hemin or SnPP or vehicle, respectively. (D) Dot plots (n = 24) showing the Pearson correlation coefficients for relationships between the concentrations of total (TCHO) or LDL cholesterol in peripheral blood and the frequencies of indicated MDSC subsets in the spleen. Bar graphs represent mean ± SD. Dots represent individual samples. n (control) = 8, n (hemin) = 6, n (SnPP) = 10. *p < 0.05, ***p < 0.001, ****p < 0.0001 (One-way ANOVA).

