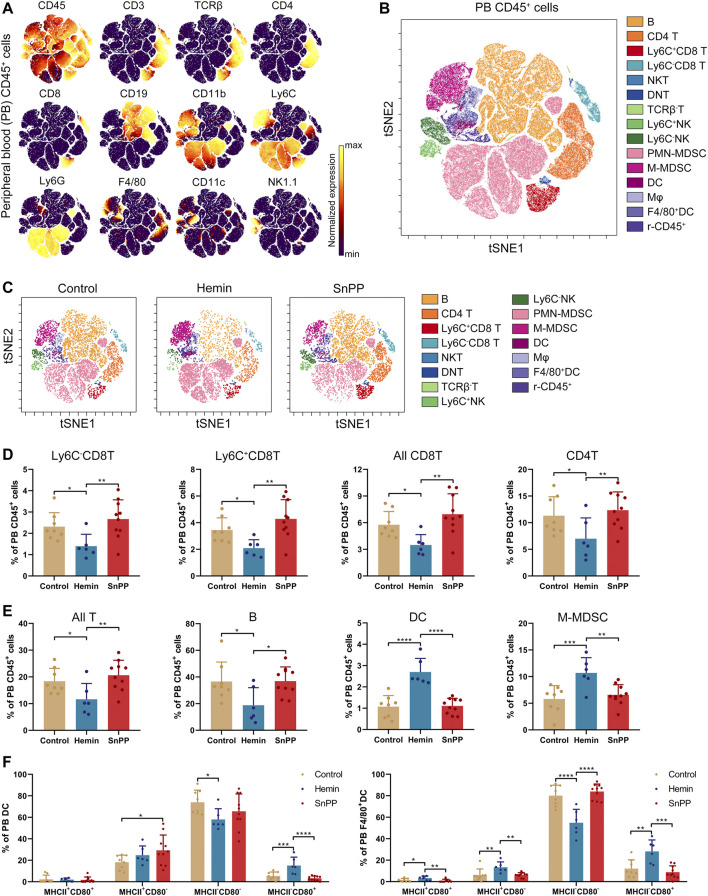
FIGURE 6.
Hemin and SnPP differently alter the immune cell populations in peripheral blood. ApoE-/- mice fed with a western-type diet were treated with hemin (n = 6) or SnPP (n = 10) or vehicle (control, n = 8) for 10 weeks. The peripheral blood (PB) cells were collected and subjected to mass cytometry analysis after staining with 26 metal isotope-labeled antibodies. (A) viSNE map showing the distribution of the PB CD45+ immune cells from all three groups. Cells on the viSNE map were colored according to the expression profiles of indicated surface markers. The color bar indicates the normalized expression of each marker. (B) 15 cell populations were identified and colored on the viSNE map. (C) Representative viSNE maps of PB CD45+ immune cells from each group. (D,E) Bar plots showing the frequencies of the indicated cell populations and sub-clusters. (F) Bar plots showing the frequencies of indicated subsets in PB DCs and F4/80+DCs. Only significant changed cell populations are shown. Bar graphs represent mean ± SD. Dots represent individual samples. n (control) = 8, n (hemin) = 6, n (SnPP) = 10. *p < 0.05, **p < 0.01, **p < 0.01, ***p < 0.001, ****p < 0.0001 (One-way ANOVA).

