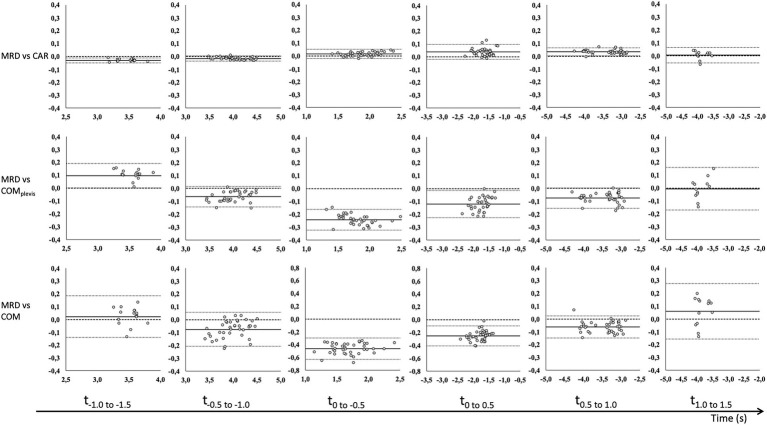
Figure 3.
Bland–Altman analysis of average velocity for 0.5 s time intervals before (−) and after (+) CoD (horizontal axis) for the MRD to CAR (top row), COMpelvis (middle row) and COM (bottom row) for 6 kg external load. Bland–Altman plots [y-axis: difference in velocity (m/s) and x-axis: average velocity (m/s)] for all trials with fixed bias (full line) with 95% confidence interval (dotted line) and agreement (dashed line).

