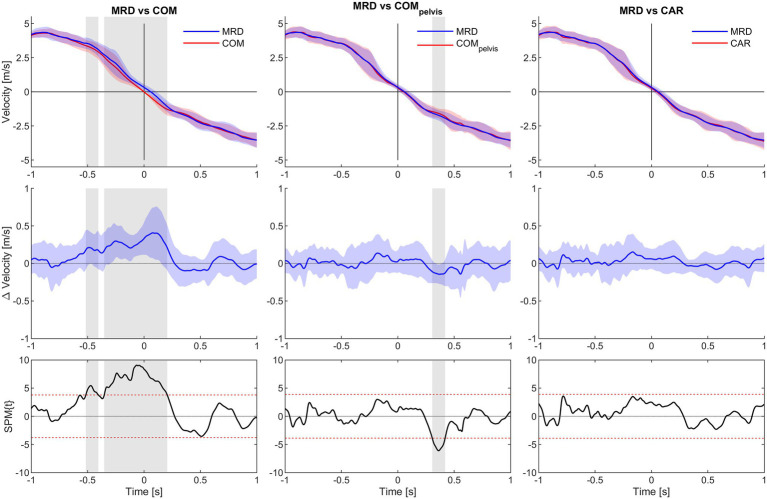
Figure 7.
SPM analysis of average velocity for 1.0 s time interval before (−) and after (+) CoD (horizontal axis all graphs) for the 9 kg condition. Columns left to right show MRD to COM, MRD to COMpelvis and MRD to CAR comparisons. Top row show average velocity of all trials with 95% confidence interval for the MRD (blue) to COM, COMpelvis and CAR (red) comparisons. Middle row show difference in velocity with 95% confidence interval. Bottom row show SPM analysis with 95% confidence interval marked with red dashed lines. Grey vertical line identify time interval of significant difference (α < 0.05).

