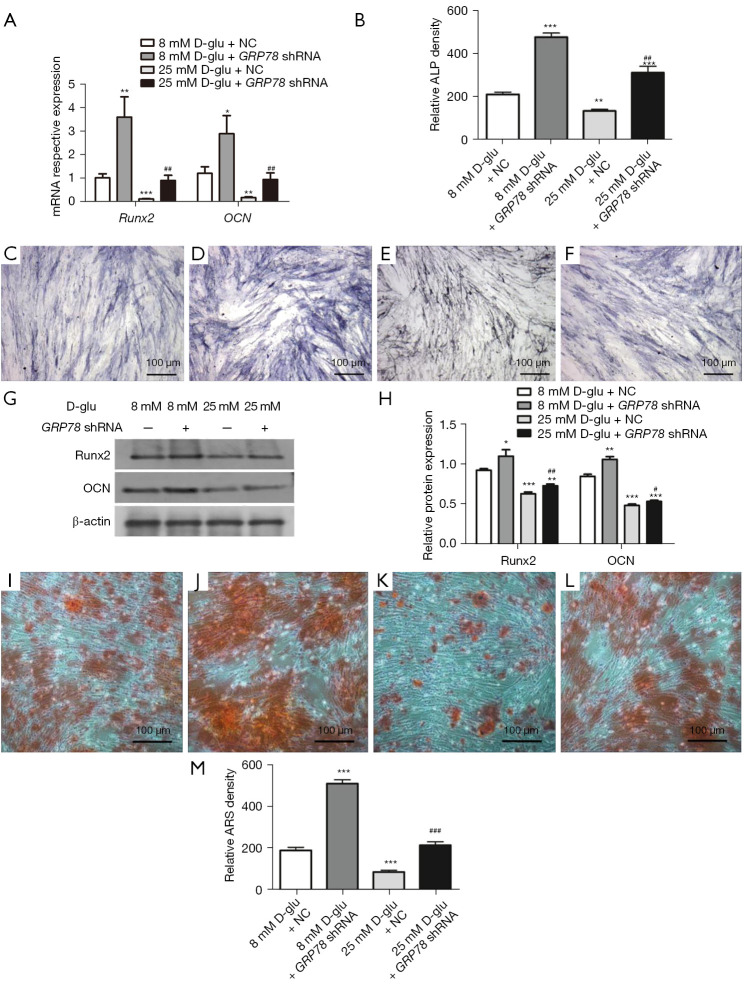
Figure 10.
The effects of GRP78 shRNA on the osteogenic differentiation ability of PDLSCs under different glucose concentrations. (A) The mRNA expression levels of osteogenic factors after 7-day osteogenic induction. (B) Comparison of the total optical density values of ALP positive staining in each group. ALP staining of PDLSCs after osteogenic induction in 8 mmol/L D-glucose + NC (control group) (C), 8 mmol/L D-glucose + GRP78 shRNA lentivirus (D), 25 mmol/L D-glucose + NC (E), and 25 mmol/L D-glucose + GRP78 shRNA lentivirus (F). (G) The protein levels of osteogenic factors, as detected by western blot. (H) Quantification of osteogenic factor protein expression, using β-actin for internal reference. Alizarin red staining of PDLSCs after osteogenic induction in 8 mmol/L D-glucose + NC (control group) (I), 8 mmol/L D-glucose + GRP78 shRNA lentivirus (J), 25 mmol/L D-glucose + NC (K), and 25 mmol/L D-glucose + GRP78 shRNA lentivirus (L). (M) Comparison of the total optical density values of alizarin red positive staining. Bar =100 µm. *, P<0.05, **, P<0.01, ***, P<0.001 compared with 8 mmol/L D-glucose + NC (control) group. #, P<0.05, ##, P<0.01, ###, P<0.001 compared with 25 mmol/L D-glucose + NC group. GRP78, glucose regulated protein 78; shRNA, short hairpin ribonucleic acid; PDLSCs, periodontal ligament stem cells; mRNA, messenger ribonucleic acid; ALP, alkaline phosphatase; NC, normal saline.

