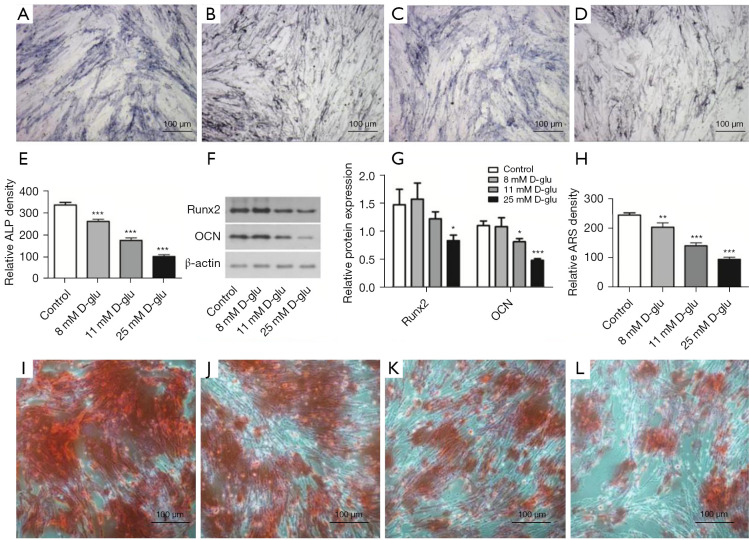
Figure 6.
The osteogenic differentiation abilities of PDLSCs cultured in osteogenic inducing medium containing D-glucose at different concentrations. ALP staining of PDLSCs after osteogenic induction in 5.6 mmol/L D-glucose (control group) (A), 8 mmol/L D-glucose (B), 11 mmol/L D-glucose (C), and 25 mmol/L D-glucose (D). (E) Comparison of the total optical density values of ALP positive staining in each group. (F) The protein levels of Runx2 and OCN were detected by western blot after 2-week osteogenic induction at different D-glucose concentrations. (G) Quantification of Runx2 and OCN protein expression. The relative quantities evaluated by band grey value were normalized to β-actin and are presented as mean ± SD. (H) Comparison of the total optical density values of alizarin red staining. Alizarin red staining of PDLSCs after osteogenic induction in 5.6 mmol/L D-glucose (control group) (I), 8 mmol/L D-glucose (J), 11 mmol/L D-glucose (K), and 25 mmol/L D-glucose (L). Bar =100 µm. *, P<0.05, **, P<0.01, ***, P<0.01 compared with the control group. PDLSCs, periodontal ligament stem cells; ALP, alkaline phosphatase; OCN, osteocalcin; Runx2, runt-related transcription factor 2; SD, standard deviation.

