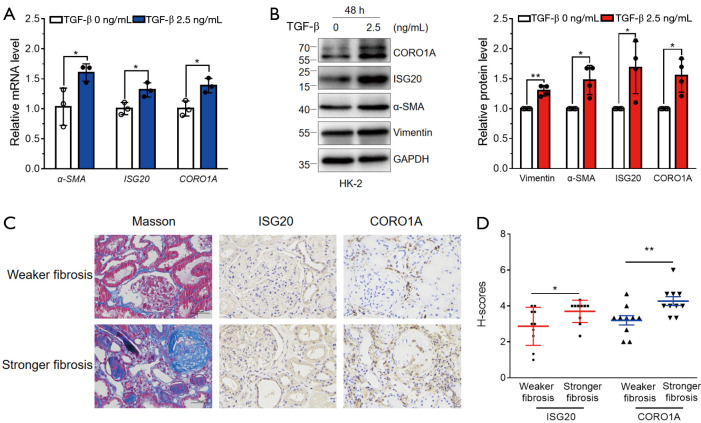
Figure 6.
Validation of the expression of CORO1A and ISG20 in fibrotic tubular cells and renal tissue. (A) CORO1A and ISG20 mRNA expression in TGF-β-stimulated HK-2 cells. HK-2 cells were stimulated with TGF-β (0 and 2.5 ng/mL) for 48 h. Relative mRNA level of α-SMA, ISG20, and CORO1A in the above cells was measured by qPCR. α-SMA was used as a fibrosis marker induced by TGF-β. Mean ± SDs were obtained from three technical replicates. Student’s t-test (two-sided), *, P<0.05. (B) CORO1A and ISG20 protein expression in TGF-β-stimulated HK-2 cells. HK-2 cells were stimulated with TGF-β (0 and 2.5 ng/mL) for 48 h. Cell lysates from the above cells were immunoblotted against Vimentin, α-SMA, ISG20, CORO1A, and GAPDH. Vimentin and α-SMA were used as fibrosis markers induced by TGF-β, and GAPDH was used as a loading control. Mean ± SDs are depicted and P value was calculated using Student’s t-test (two-sided) with data from four biological replicates. *, P<0.05; **, P<0.01. (C,D) CORO1A and ISG20 protein expression in fibrotic renal tissue. Renal tissues from CKD patients with different degree of fibrosis were stained for CORO1A and ISG20 by immunohistochemistry. Representative images of Masson staining and immunohistochemistry staining for CORO1A and ISG20 in renal tissues (C). Scale bar: 50 mm. The expression level of CORO1A and ISG20 (D) in renal tissues with different degrees of fibrosis. Student’s t-test (two-sided), *, P<0.05; **, P<0.01. TGF-β, transforming growth factor-β; α-SMA, α-smooth muscle actin; CKD, chronic kidney disease.

