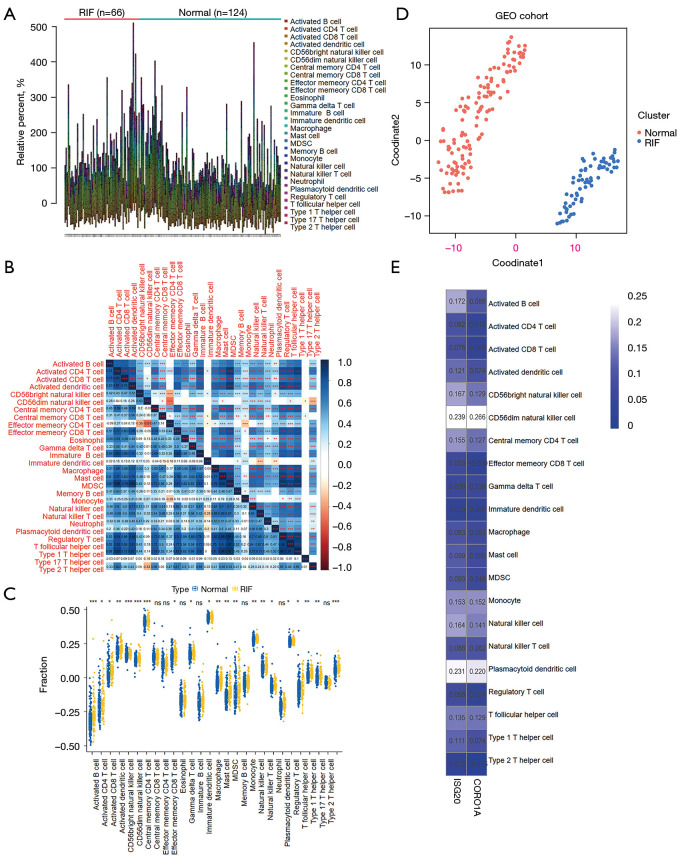
Figure 8.
Distribution of immune cells in RIF. (A) The infiltration levels in RIF and normal samples. The ssGSEA algorithm in “GSVA” R package was employed to calculate the infiltration levels of 28 immune cell types in 66 samples with RIF and 124 normal samples from the GSE22459 and GSE76882 datasets. (B) Correlation heatmap of 28 types of immune cells. The numbers in the lower left quarter represent the correlation coefficient between row-defining immune cells and column-defining immune cells, while the statistical significance is highlighted in the upper right quarter. Pearson rank correlation test, *, P<0.05; **, P<0.01; ***, P<0.00. (C) Comparisons of immune cell infiltration between RIF and normal samples. Wilcoxon test, *, P<0.05; **, P<0.01; ***, P<0.001; ns, not significant. (D) Distribution of the cohort differentially infiltrated immune cells (DIICs). t-SNE method was applied to cluster and visualize the distribution of DIICs in the GEO cohort. (E) Correlations between DIICs and diagnostic biomarkers. The numbers in the frame represent the Spearman correlation coefficient between each DIIC and ISG20 or CORO1A. RIF, renal interstitial fibrosis; DIIC, differentially infiltrated immune cell; GEO, Gene Expression Omnibus.

