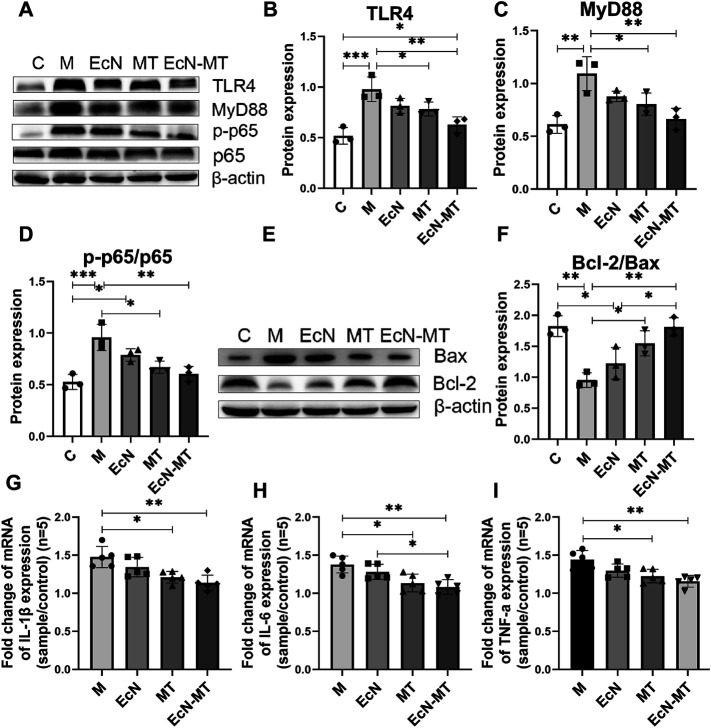
FIGURE 3.
EcN-MT reduced liver inflammation and apoptosis. Values are presented as means ± SD (n = 3, except q-PCR results repeated five times). (A) Western bloting analysis of TLR4, MyD88, p-p65, p65 expression in liver tissues. The relative expressions of (B) TLR4, (C) MyD88, (D) p-p65/p65 were quantified by ImageJ. β-actin was used as an internal control. (E) Western bloting analysis of Bax, Bcl-2 expression in liver tissues. (F) The relative expressions of Bcl-2/Bax were quantified by ImageJ. β-actin was used as an internal control. The relative mRNA expressions of (G) IL-1β, (H) IL-6, (I) TNF-α in liver tissues were detected by q-PCR. *p < 0.05, **p < 0.01, ***p < 0.001.

