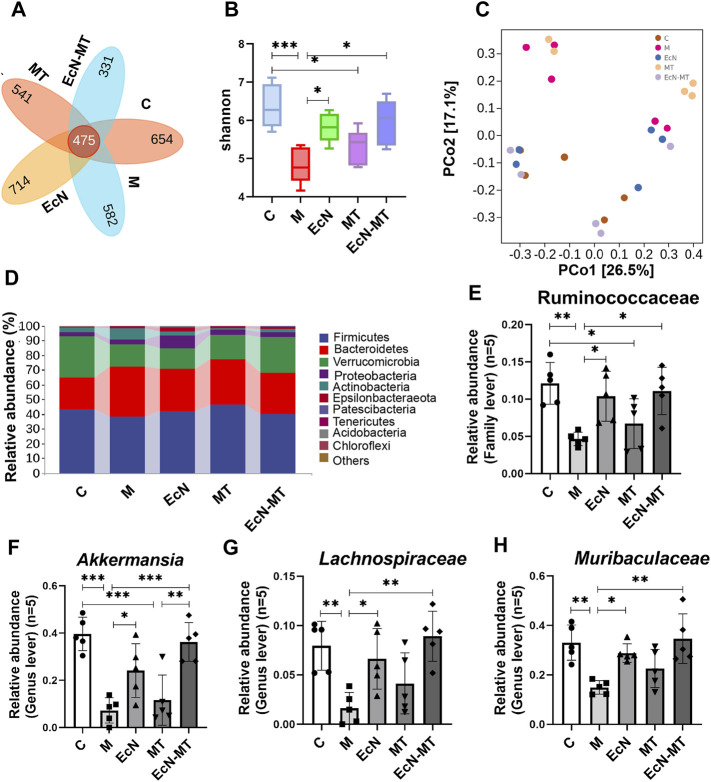
FIGURE 4.
EcN-MT improved intestinal microbiota in subchronic Cd-exposed mice. Values are presented as means ± SD (n = 5). (A) Venn map representation of OTUs. (B) The Shannon index. (C) PCoA of β diversity index. (D) Microbial composition at the phyla level. The relative abundance of (E) Ruminococcaceae, (F) Akkermansia, (G) Muribaculaceae, (H) Lachnospiraceae were analyzed. *p < 0.05, **p < 0.01, ***p < 0.001.

