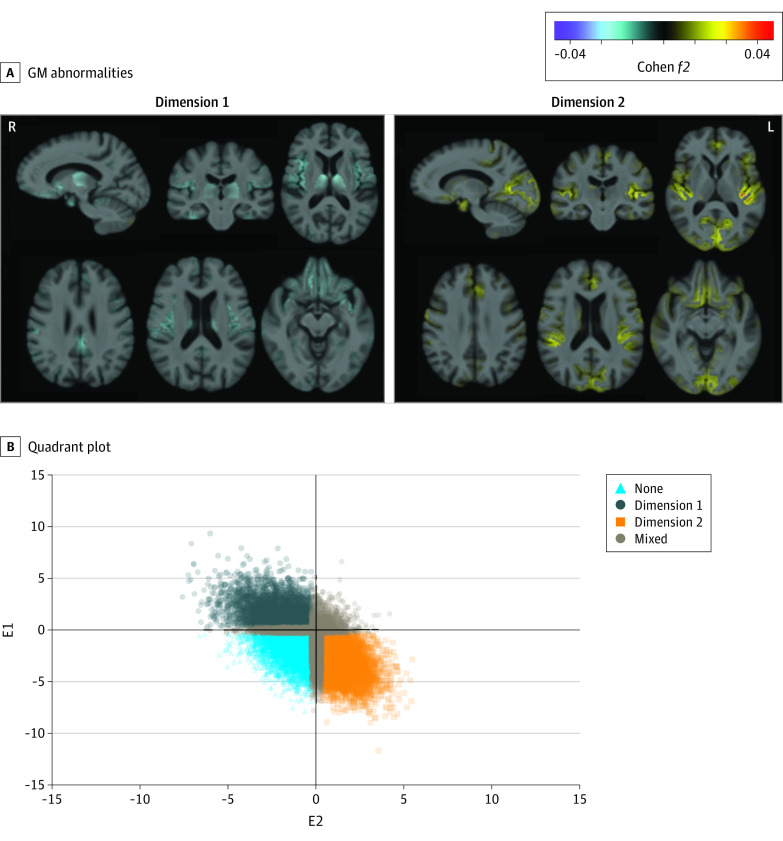
Figure 3. Expression of the 2 Dimensions in the General Population.
A, The 2 neuroanatomical dimensions in UK Biobank (UKBB) show distinct gray matter (GM) abnormalities. Effect size maps of GM patterns were identified in dimension 1 and dimension 2 compared with none (the dimension that does not express in dimension 1 or 2), respectively. Multiple selective views are shown with the number of slices in the axial view. Warmer color denotes brain atrophy (ie, none > dimension), and cooler color represents larger tissue volume (ie, dimension > none). Both directions are shown for each dimension. Cohen f2 of ≥0.02, ≥0.15, and ≥0.35 signify small, moderate, and large effect sizes, respectively. L indicates left; R, right. The effect size map is shown in a radiological fashion such that the left of the brain is shown to the right of the display. We include age, sex, and intracranial volume as fixed effects and group (none vs dimension 1 or dimension 2) as the variable of interest. The likelihood ratio test was used to test each effect. B, The quadrant plot after applying the heterogeneity through discriminative analysis model trained on the late-life depression population to the external UKBB individuals. The x-axis and y-axis represent the expression scores for each individual at dimension 1 and dimension 2, respectively. Dimension membership was decided based on the 2 expression scores, E1 and E2. Specifically, an individual was assigned to none when E1 and E2 were less than −0.3, as dimension 1 when E1 was less than 0.3 and E2 less than −0.3, as dimension 2 when E1 was less than−0.3 and E2 greater than 0.3, and as mixed for the other individuals.

